Ethiopian vs Cuban 10th Grade
COMPARE
Ethiopian
Cuban
10th Grade
10th Grade Comparison
Ethiopians
Cubans
93.2%
10TH GRADE
7.9/ 100
METRIC RATING
222nd/ 347
METRIC RANK
91.5%
10TH GRADE
0.0/ 100
METRIC RATING
298th/ 347
METRIC RANK
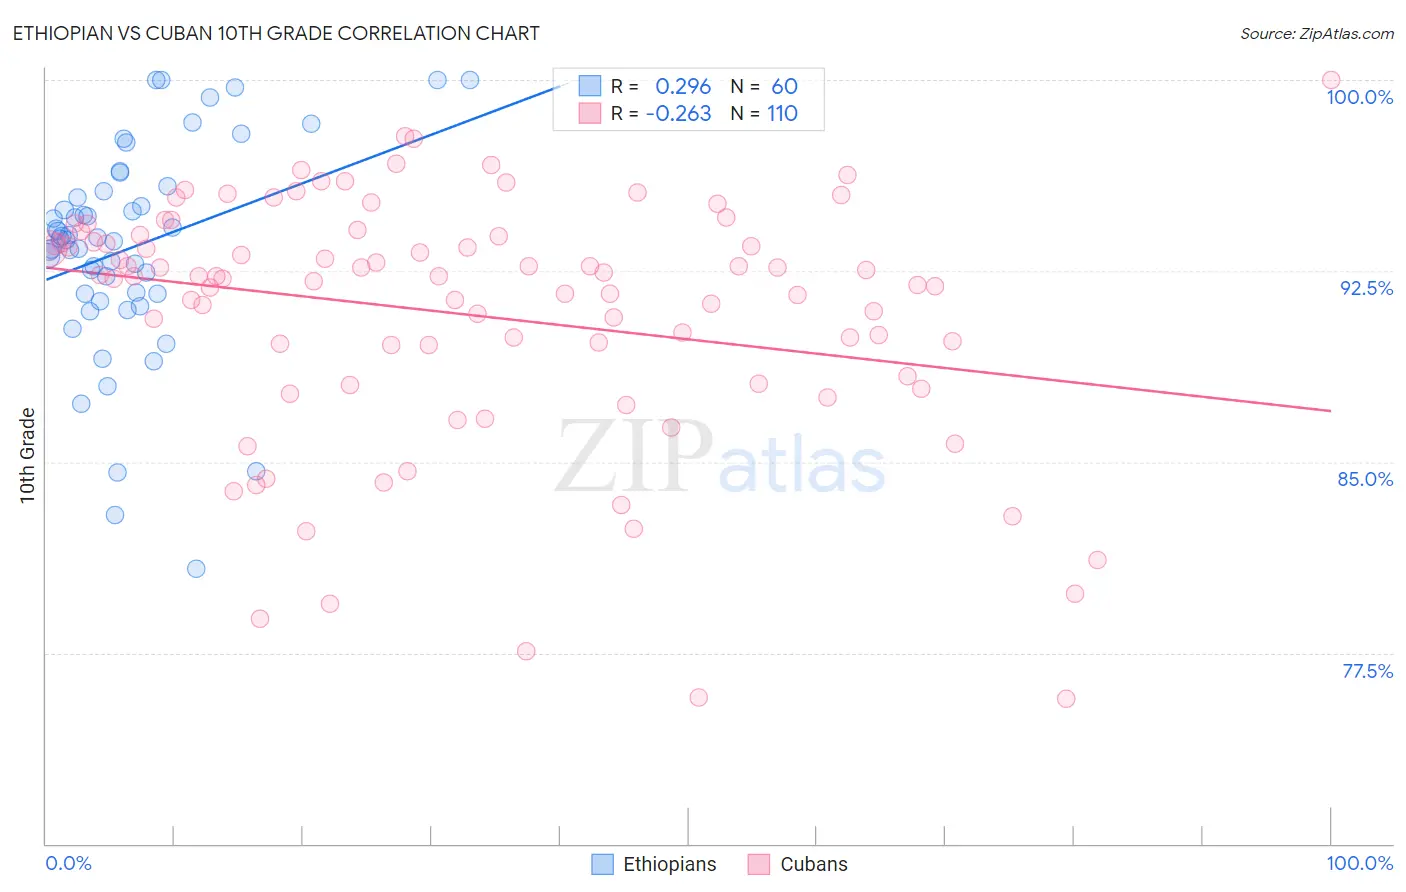
Ethiopian vs Cuban 10th Grade Correlation Chart
The statistical analysis conducted on geographies consisting of 223,161,778 people shows a weak positive correlation between the proportion of Ethiopians and percentage of population with at least 10th grade education in the United States with a correlation coefficient (R) of 0.296 and weighted average of 93.2%. Similarly, the statistical analysis conducted on geographies consisting of 449,373,052 people shows a weak negative correlation between the proportion of Cubans and percentage of population with at least 10th grade education in the United States with a correlation coefficient (R) of -0.263 and weighted average of 91.5%, a difference of 1.9%.
10th Grade Correlation Summary
| Measurement | Ethiopian | Cuban |
| Minimum | 80.8% | 75.7% |
| Maximum | 100.0% | 100.0% |
| Range | 19.2% | 24.3% |
| Mean | 93.4% | 90.8% |
| Median | 93.7% | 92.3% |
| Interquartile 25% (IQ1) | 91.6% | 88.3% |
| Interquartile 75% (IQ3) | 95.5% | 93.9% |
| Interquartile Range (IQR) | 3.9% | 5.5% |
| Standard Deviation (Sample) | 4.1% | 4.9% |
| Standard Deviation (Population) | 4.1% | 4.9% |
Similar Demographics by 10th Grade
Demographics Similar to Ethiopians by 10th Grade
In terms of 10th grade, the demographic groups most similar to Ethiopians are Immigrants from Sierra Leone (93.2%, a difference of 0.010%), Immigrants from Southern Europe (93.2%, a difference of 0.030%), Bolivian (93.2%, a difference of 0.040%), Tongan (93.3%, a difference of 0.050%), and Seminole (93.3%, a difference of 0.060%).
| Demographics | Rating | Rank | 10th Grade |
| Immigrants | Oceania | 15.1 /100 | #215 | Poor 93.4% |
| Immigrants | Eastern Africa | 14.7 /100 | #216 | Poor 93.4% |
| Portuguese | 12.1 /100 | #217 | Poor 93.3% |
| Immigrants | Liberia | 10.2 /100 | #218 | Poor 93.3% |
| Seminole | 10.2 /100 | #219 | Poor 93.3% |
| Tongans | 9.5 /100 | #220 | Tragic 93.3% |
| Immigrants | Southern Europe | 8.9 /100 | #221 | Tragic 93.2% |
| Ethiopians | 7.9 /100 | #222 | Tragic 93.2% |
| Immigrants | Sierra Leone | 7.6 /100 | #223 | Tragic 93.2% |
| Bolivians | 6.7 /100 | #224 | Tragic 93.2% |
| Somalis | 6.2 /100 | #225 | Tragic 93.2% |
| Koreans | 6.1 /100 | #226 | Tragic 93.2% |
| Blacks/African Americans | 6.0 /100 | #227 | Tragic 93.2% |
| Immigrants | China | 5.9 /100 | #228 | Tragic 93.2% |
| Immigrants | Ethiopia | 5.1 /100 | #229 | Tragic 93.1% |
Demographics Similar to Cubans by 10th Grade
In terms of 10th grade, the demographic groups most similar to Cubans are Fijian (91.5%, a difference of 0.020%), Immigrants from Haiti (91.4%, a difference of 0.080%), Guyanese (91.4%, a difference of 0.12%), Immigrants from Grenada (91.6%, a difference of 0.17%), and Japanese (91.2%, a difference of 0.27%).
| Demographics | Rating | Rank | 10th Grade |
| Immigrants | West Indies | 0.0 /100 | #291 | Tragic 91.8% |
| Immigrants | Burma/Myanmar | 0.0 /100 | #292 | Tragic 91.8% |
| Indonesians | 0.0 /100 | #293 | Tragic 91.8% |
| Haitians | 0.0 /100 | #294 | Tragic 91.8% |
| Lumbee | 0.0 /100 | #295 | Tragic 91.7% |
| Immigrants | Grenada | 0.0 /100 | #296 | Tragic 91.6% |
| Fijians | 0.0 /100 | #297 | Tragic 91.5% |
| Cubans | 0.0 /100 | #298 | Tragic 91.5% |
| Immigrants | Haiti | 0.0 /100 | #299 | Tragic 91.4% |
| Guyanese | 0.0 /100 | #300 | Tragic 91.4% |
| Japanese | 0.0 /100 | #301 | Tragic 91.2% |
| Immigrants | Guyana | 0.0 /100 | #302 | Tragic 91.2% |
| Immigrants | Vietnam | 0.0 /100 | #303 | Tragic 91.2% |
| Pima | 0.0 /100 | #304 | Tragic 91.2% |
| Immigrants | Dominica | 0.0 /100 | #305 | Tragic 91.1% |