Egyptian vs Czech Male Poverty
COMPARE
Egyptian
Czech
Male Poverty
Male Poverty Comparison
Egyptians
Czechs
10.3%
MALE POVERTY
95.9/ 100
METRIC RATING
82nd/ 347
METRIC RANK
9.8%
MALE POVERTY
99.4/ 100
METRIC RATING
36th/ 347
METRIC RANK
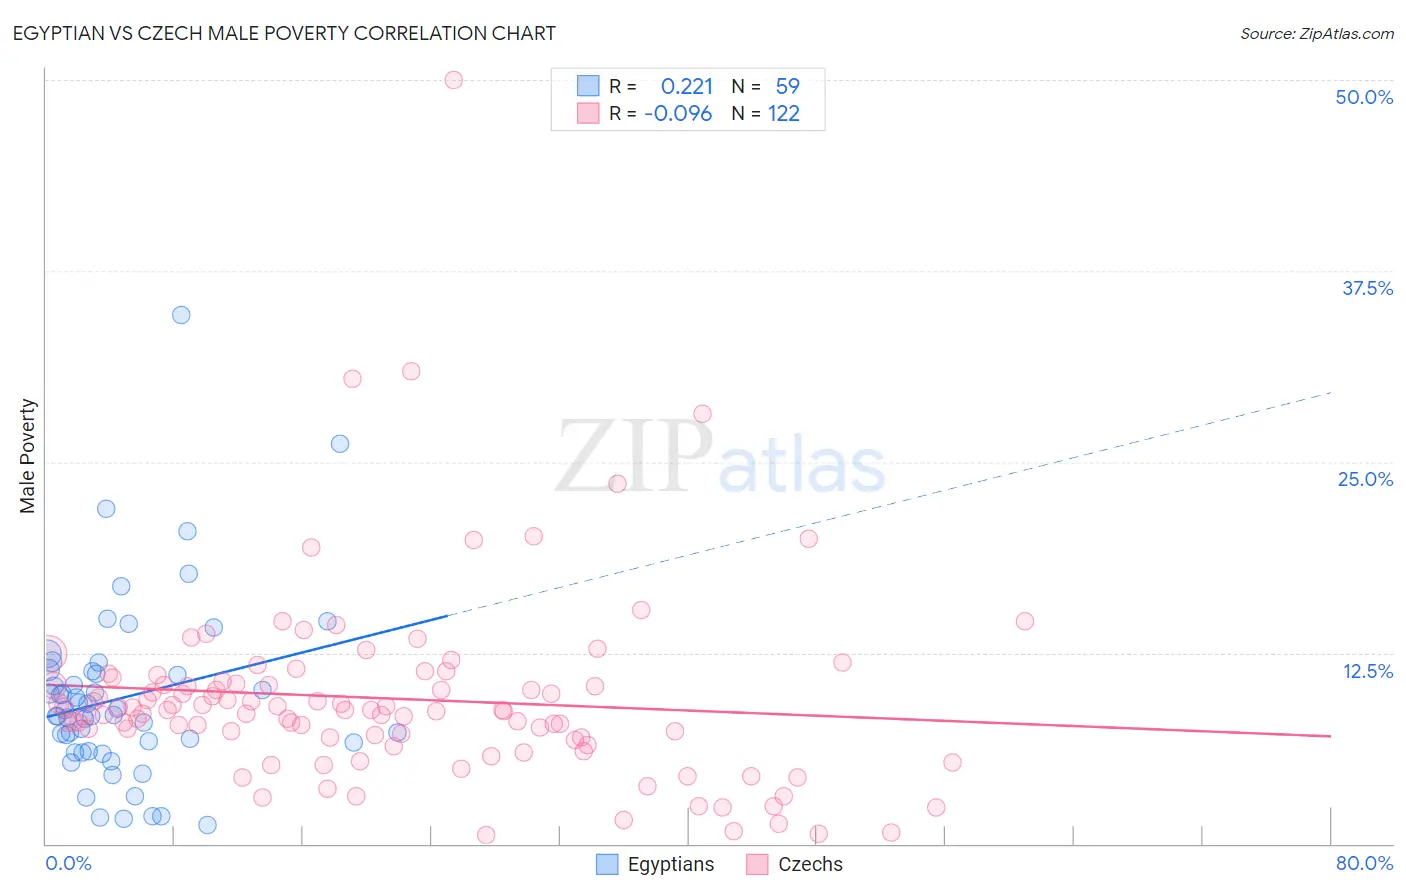
Egyptian vs Czech Male Poverty Correlation Chart
The statistical analysis conducted on geographies consisting of 276,705,416 people shows a weak positive correlation between the proportion of Egyptians and poverty level among males in the United States with a correlation coefficient (R) of 0.221 and weighted average of 10.3%. Similarly, the statistical analysis conducted on geographies consisting of 484,041,978 people shows a slight negative correlation between the proportion of Czechs and poverty level among males in the United States with a correlation coefficient (R) of -0.096 and weighted average of 9.8%, a difference of 5.4%.
Male Poverty Correlation Summary
| Measurement | Egyptian | Czech |
| Minimum | 1.2% | 0.55% |
| Maximum | 34.6% | 50.0% |
| Range | 33.4% | 49.5% |
| Mean | 9.6% | 9.5% |
| Median | 8.4% | 8.7% |
| Interquartile 25% (IQ1) | 6.1% | 7.0% |
| Interquartile 75% (IQ3) | 11.3% | 10.4% |
| Interquartile Range (IQR) | 5.2% | 3.5% |
| Standard Deviation (Sample) | 5.9% | 6.4% |
| Standard Deviation (Population) | 5.9% | 6.4% |
Similar Demographics by Male Poverty
Demographics Similar to Egyptians by Male Poverty
In terms of male poverty, the demographic groups most similar to Egyptians are Belgian (10.3%, a difference of 0.0%), Immigrants from Sweden (10.3%, a difference of 0.12%), Czechoslovakian (10.3%, a difference of 0.19%), Immigrants from England (10.4%, a difference of 0.23%), and Immigrants from Eastern Asia (10.4%, a difference of 0.37%).
| Demographics | Rating | Rank | Male Poverty |
| Carpatho Rusyns | 96.9 /100 | #75 | Exceptional 10.2% |
| Dutch | 96.9 /100 | #76 | Exceptional 10.2% |
| Immigrants | Belgium | 96.8 /100 | #77 | Exceptional 10.3% |
| Irish | 96.8 /100 | #78 | Exceptional 10.3% |
| Immigrants | North America | 96.5 /100 | #79 | Exceptional 10.3% |
| English | 96.4 /100 | #80 | Exceptional 10.3% |
| Belgians | 95.9 /100 | #81 | Exceptional 10.3% |
| Egyptians | 95.9 /100 | #82 | Exceptional 10.3% |
| Immigrants | Sweden | 95.7 /100 | #83 | Exceptional 10.3% |
| Czechoslovakians | 95.6 /100 | #84 | Exceptional 10.3% |
| Immigrants | England | 95.5 /100 | #85 | Exceptional 10.4% |
| Immigrants | Eastern Asia | 95.3 /100 | #86 | Exceptional 10.4% |
| Northern Europeans | 95.2 /100 | #87 | Exceptional 10.4% |
| Cambodians | 95.0 /100 | #88 | Exceptional 10.4% |
| Immigrants | Denmark | 95.0 /100 | #89 | Exceptional 10.4% |
Demographics Similar to Czechs by Male Poverty
In terms of male poverty, the demographic groups most similar to Czechs are Iranian (9.8%, a difference of 0.090%), Immigrants from Greece (9.8%, a difference of 0.22%), Immigrants from Poland (9.8%, a difference of 0.39%), Immigrants from Northern Europe (9.7%, a difference of 0.54%), and Immigrants from Pakistan (9.9%, a difference of 0.59%).
| Demographics | Rating | Rank | Male Poverty |
| Greeks | 99.6 /100 | #29 | Exceptional 9.7% |
| Poles | 99.5 /100 | #30 | Exceptional 9.7% |
| Tongans | 99.5 /100 | #31 | Exceptional 9.7% |
| Macedonians | 99.5 /100 | #32 | Exceptional 9.7% |
| Immigrants | Northern Europe | 99.5 /100 | #33 | Exceptional 9.7% |
| Immigrants | Poland | 99.5 /100 | #34 | Exceptional 9.8% |
| Iranians | 99.4 /100 | #35 | Exceptional 9.8% |
| Czechs | 99.4 /100 | #36 | Exceptional 9.8% |
| Immigrants | Greece | 99.3 /100 | #37 | Exceptional 9.8% |
| Immigrants | Pakistan | 99.2 /100 | #38 | Exceptional 9.9% |
| Russians | 99.2 /100 | #39 | Exceptional 9.9% |
| Cypriots | 99.2 /100 | #40 | Exceptional 9.9% |
| Koreans | 99.2 /100 | #41 | Exceptional 9.9% |
| Immigrants | Iran | 99.1 /100 | #42 | Exceptional 9.9% |
| Immigrants | Moldova | 99.0 /100 | #43 | Exceptional 9.9% |