Alaska Native vs Immigrants from Chile In Labor Force | Age 35-44
COMPARE
Alaska Native
Immigrants from Chile
In Labor Force | Age 35-44
In Labor Force | Age 35-44 Comparison
Alaska Natives
Immigrants from Chile
81.6%
IN LABOR FORCE | AGE 35-44
0.0/ 100
METRIC RATING
312th/ 347
METRIC RANK
84.6%
IN LABOR FORCE | AGE 35-44
84.6/ 100
METRIC RATING
137th/ 347
METRIC RANK
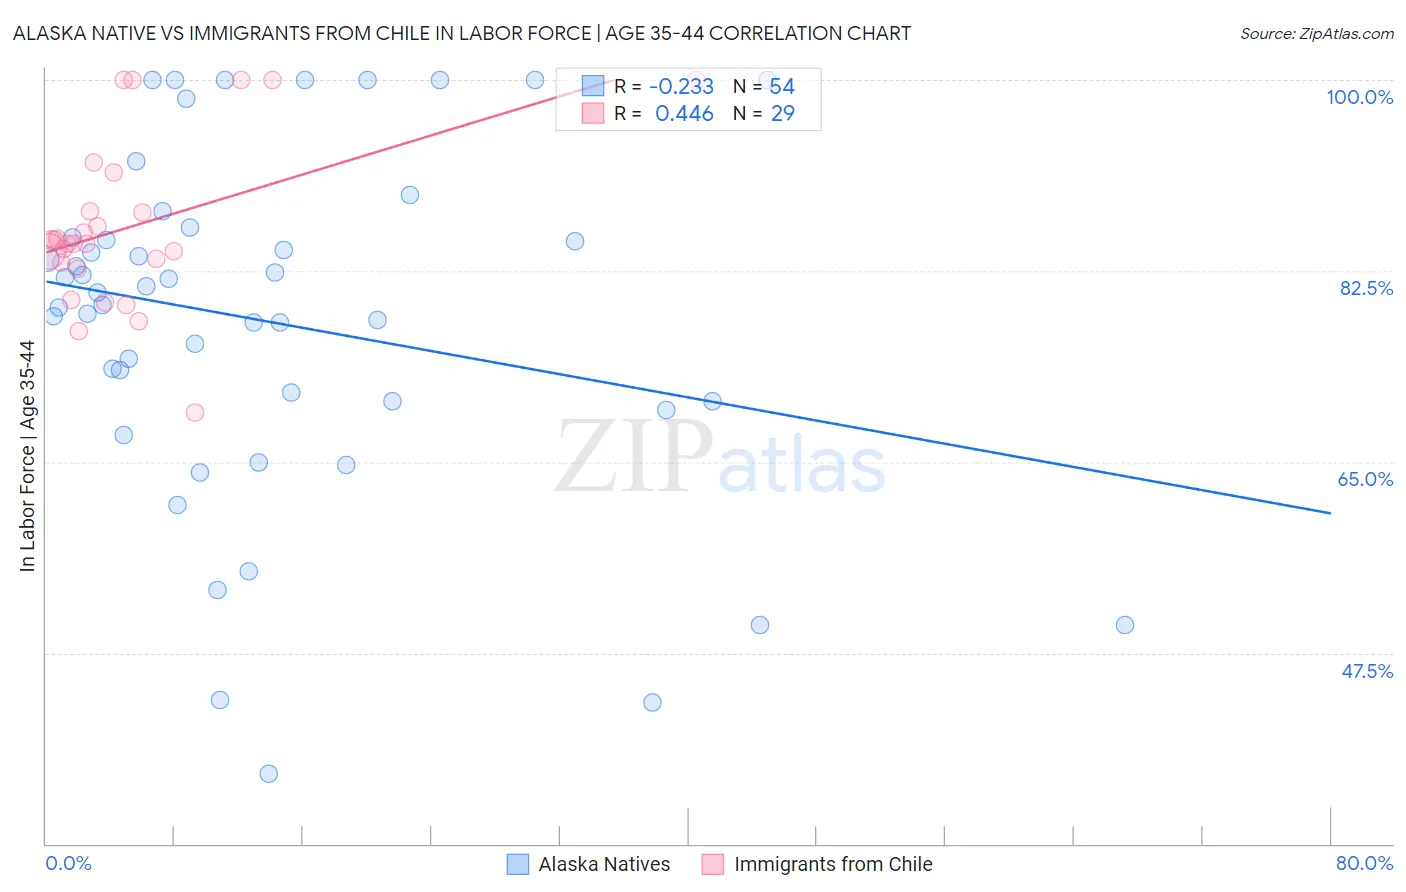
Alaska Native vs Immigrants from Chile In Labor Force | Age 35-44 Correlation Chart
The statistical analysis conducted on geographies consisting of 76,764,235 people shows a weak negative correlation between the proportion of Alaska Natives and labor force participation rate among population between the ages 35 and 44 in the United States with a correlation coefficient (R) of -0.233 and weighted average of 81.6%. Similarly, the statistical analysis conducted on geographies consisting of 218,627,493 people shows a moderate positive correlation between the proportion of Immigrants from Chile and labor force participation rate among population between the ages 35 and 44 in the United States with a correlation coefficient (R) of 0.446 and weighted average of 84.6%, a difference of 3.7%.
In Labor Force | Age 35-44 Correlation Summary
| Measurement | Alaska Native | Immigrants from Chile |
| Minimum | 36.4% | 69.5% |
| Maximum | 100.0% | 100.0% |
| Range | 63.6% | 30.5% |
| Mean | 77.8% | 86.5% |
| Median | 79.9% | 85.0% |
| Interquartile 25% (IQ1) | 70.5% | 83.0% |
| Interquartile 75% (IQ3) | 85.5% | 89.7% |
| Interquartile Range (IQR) | 15.0% | 6.7% |
| Standard Deviation (Sample) | 15.9% | 7.6% |
| Standard Deviation (Population) | 15.7% | 7.5% |
Similar Demographics by In Labor Force | Age 35-44
Demographics Similar to Alaska Natives by In Labor Force | Age 35-44
In terms of in labor force | age 35-44, the demographic groups most similar to Alaska Natives are Mexican (81.6%, a difference of 0.0%), Cajun (81.5%, a difference of 0.12%), Colville (81.7%, a difference of 0.14%), Immigrants from Mexico (81.5%, a difference of 0.14%), and Comanche (81.5%, a difference of 0.16%).
| Demographics | Rating | Rank | In Labor Force | Age 35-44 |
| Shoshone | 0.0 /100 | #305 | Tragic 82.2% |
| Blacks/African Americans | 0.0 /100 | #306 | Tragic 82.2% |
| Hispanics or Latinos | 0.0 /100 | #307 | Tragic 82.1% |
| Immigrants | Central America | 0.0 /100 | #308 | Tragic 82.0% |
| Cree | 0.0 /100 | #309 | Tragic 82.0% |
| Blackfeet | 0.0 /100 | #310 | Tragic 81.9% |
| Colville | 0.0 /100 | #311 | Tragic 81.7% |
| Alaska Natives | 0.0 /100 | #312 | Tragic 81.6% |
| Mexicans | 0.0 /100 | #313 | Tragic 81.6% |
| Cajuns | 0.0 /100 | #314 | Tragic 81.5% |
| Immigrants | Mexico | 0.0 /100 | #315 | Tragic 81.5% |
| Comanche | 0.0 /100 | #316 | Tragic 81.5% |
| Cherokee | 0.0 /100 | #317 | Tragic 81.4% |
| Alaskan Athabascans | 0.0 /100 | #318 | Tragic 81.3% |
| Inupiat | 0.0 /100 | #319 | Tragic 80.9% |
Demographics Similar to Immigrants from Chile by In Labor Force | Age 35-44
In terms of in labor force | age 35-44, the demographic groups most similar to Immigrants from Chile are Afghan (84.6%, a difference of 0.020%), Czechoslovakian (84.6%, a difference of 0.020%), Immigrants from Zaire (84.6%, a difference of 0.020%), Immigrants from Malaysia (84.6%, a difference of 0.040%), and Immigrants from Japan (84.6%, a difference of 0.040%).
| Demographics | Rating | Rank | In Labor Force | Age 35-44 |
| Bhutanese | 89.7 /100 | #130 | Excellent 84.7% |
| Immigrants | Scotland | 89.6 /100 | #131 | Excellent 84.7% |
| Austrians | 89.4 /100 | #132 | Excellent 84.7% |
| Argentineans | 88.4 /100 | #133 | Excellent 84.6% |
| Immigrants | Korea | 88.2 /100 | #134 | Excellent 84.6% |
| Immigrants | Malaysia | 87.5 /100 | #135 | Excellent 84.6% |
| Afghans | 86.3 /100 | #136 | Excellent 84.6% |
| Immigrants | Chile | 84.6 /100 | #137 | Excellent 84.6% |
| Czechoslovakians | 82.6 /100 | #138 | Excellent 84.6% |
| Immigrants | Zaire | 82.5 /100 | #139 | Excellent 84.6% |
| Immigrants | Japan | 81.4 /100 | #140 | Excellent 84.6% |
| Immigrants | Belgium | 80.8 /100 | #141 | Excellent 84.6% |
| Immigrants | Uruguay | 80.1 /100 | #142 | Excellent 84.6% |
| Immigrants | Ukraine | 79.7 /100 | #143 | Good 84.6% |
| Immigrants | Jamaica | 79.4 /100 | #144 | Good 84.6% |