Delaware vs Laotian In Labor Force | Age 20-64
COMPARE
Delaware
Laotian
In Labor Force | Age 20-64
In Labor Force | Age 20-64 Comparison
Delaware
Laotians
77.8%
IN LABOR FORCE | AGE 20-64
0.0/ 100
METRIC RATING
293rd/ 347
METRIC RANK
79.6%
IN LABOR FORCE | AGE 20-64
58.4/ 100
METRIC RATING
169th/ 347
METRIC RANK
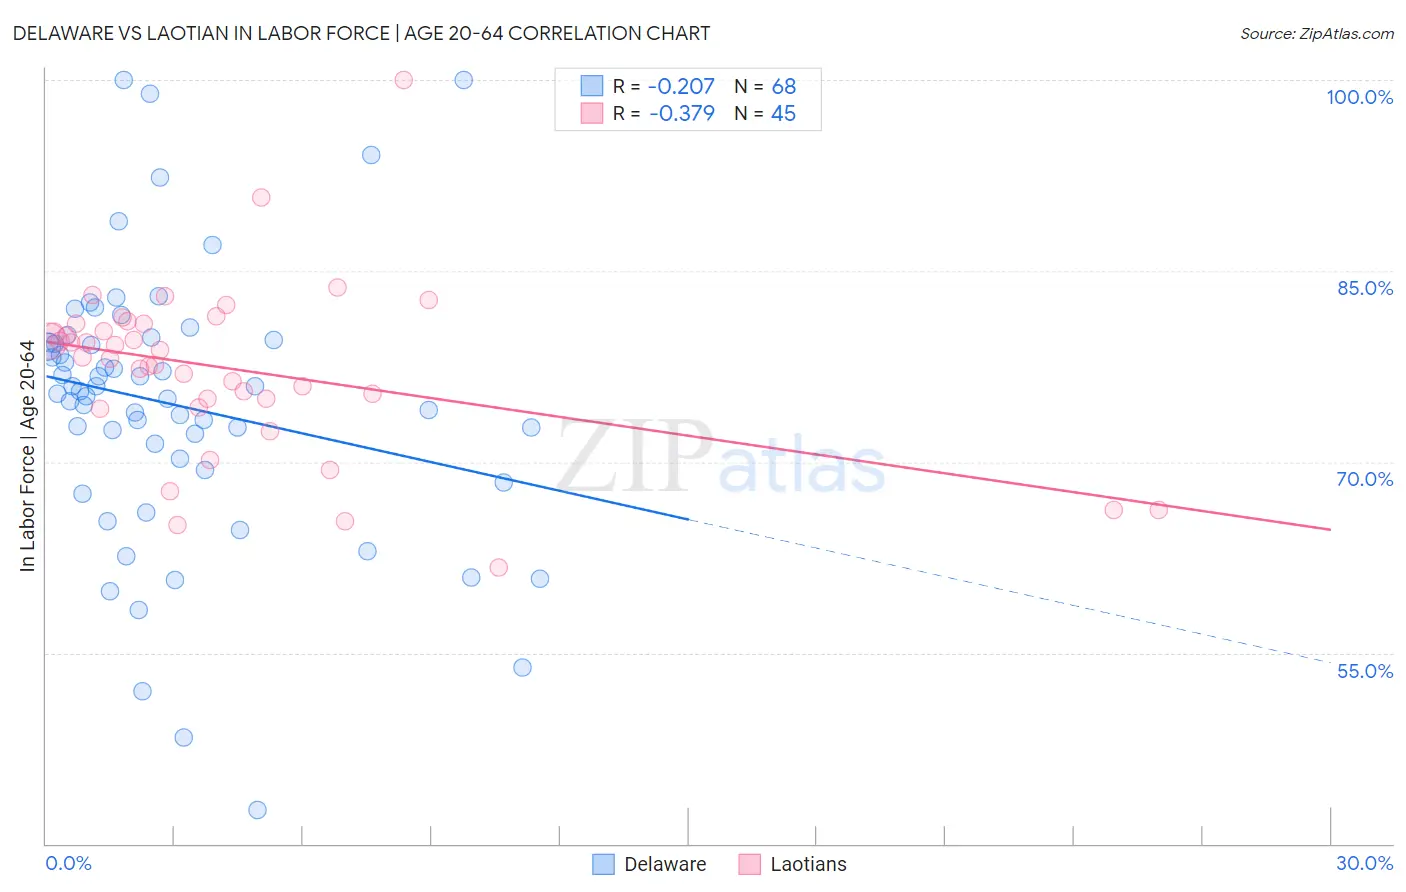
Delaware vs Laotian In Labor Force | Age 20-64 Correlation Chart
The statistical analysis conducted on geographies consisting of 96,240,999 people shows a weak negative correlation between the proportion of Delaware and labor force participation rate among population between the ages 20 and 64 in the United States with a correlation coefficient (R) of -0.207 and weighted average of 77.8%. Similarly, the statistical analysis conducted on geographies consisting of 224,862,184 people shows a mild negative correlation between the proportion of Laotians and labor force participation rate among population between the ages 20 and 64 in the United States with a correlation coefficient (R) of -0.379 and weighted average of 79.6%, a difference of 2.4%.
In Labor Force | Age 20-64 Correlation Summary
| Measurement | Delaware | Laotian |
| Minimum | 42.7% | 61.7% |
| Maximum | 100.0% | 100.0% |
| Range | 57.3% | 38.3% |
| Mean | 74.5% | 77.3% |
| Median | 75.4% | 78.3% |
| Interquartile 25% (IQ1) | 69.8% | 74.7% |
| Interquartile 75% (IQ3) | 79.5% | 80.8% |
| Interquartile Range (IQR) | 9.7% | 6.2% |
| Standard Deviation (Sample) | 10.9% | 6.8% |
| Standard Deviation (Population) | 10.8% | 6.7% |
Similar Demographics by In Labor Force | Age 20-64
Demographics Similar to Delaware by In Labor Force | Age 20-64
In terms of in labor force | age 20-64, the demographic groups most similar to Delaware are Immigrants from the Azores (77.8%, a difference of 0.040%), Spanish American (77.8%, a difference of 0.090%), Immigrants from Central America (77.7%, a difference of 0.090%), Immigrants from Grenada (77.7%, a difference of 0.12%), and Immigrants from Bangladesh (77.9%, a difference of 0.14%).
| Demographics | Rating | Rank | In Labor Force | Age 20-64 |
| Immigrants | Belize | 0.0 /100 | #286 | Tragic 78.0% |
| Vietnamese | 0.0 /100 | #287 | Tragic 78.0% |
| Hmong | 0.0 /100 | #288 | Tragic 77.9% |
| Africans | 0.0 /100 | #289 | Tragic 77.9% |
| Immigrants | Bangladesh | 0.0 /100 | #290 | Tragic 77.9% |
| Spanish Americans | 0.0 /100 | #291 | Tragic 77.8% |
| Immigrants | Azores | 0.0 /100 | #292 | Tragic 77.8% |
| Delaware | 0.0 /100 | #293 | Tragic 77.8% |
| Immigrants | Central America | 0.0 /100 | #294 | Tragic 77.7% |
| Immigrants | Grenada | 0.0 /100 | #295 | Tragic 77.7% |
| Immigrants | Dominican Republic | 0.0 /100 | #296 | Tragic 77.7% |
| Dominicans | 0.0 /100 | #297 | Tragic 77.7% |
| Cree | 0.0 /100 | #298 | Tragic 77.7% |
| Hispanics or Latinos | 0.0 /100 | #299 | Tragic 77.6% |
| Spanish American Indians | 0.0 /100 | #300 | Tragic 77.6% |
Demographics Similar to Laotians by In Labor Force | Age 20-64
In terms of in labor force | age 20-64, the demographic groups most similar to Laotians are Immigrants from Iraq (79.6%, a difference of 0.030%), Immigrants from Indonesia (79.6%, a difference of 0.030%), Okinawan (79.6%, a difference of 0.040%), Slavic (79.6%, a difference of 0.040%), and Immigrants from Switzerland (79.6%, a difference of 0.040%).
| Demographics | Rating | Rank | In Labor Force | Age 20-64 |
| Germans | 65.2 /100 | #162 | Good 79.7% |
| Immigrants | Costa Rica | 64.6 /100 | #163 | Good 79.7% |
| Immigrants | Burma/Myanmar | 64.4 /100 | #164 | Good 79.7% |
| Nigerians | 64.0 /100 | #165 | Good 79.7% |
| Okinawans | 62.7 /100 | #166 | Good 79.6% |
| Immigrants | Iraq | 62.0 /100 | #167 | Good 79.6% |
| Immigrants | Indonesia | 61.8 /100 | #168 | Good 79.6% |
| Laotians | 58.4 /100 | #169 | Average 79.6% |
| Slavs | 54.0 /100 | #170 | Average 79.6% |
| Immigrants | Switzerland | 53.3 /100 | #171 | Average 79.6% |
| Immigrants | Belgium | 53.1 /100 | #172 | Average 79.6% |
| Immigrants | Scotland | 52.4 /100 | #173 | Average 79.6% |
| Syrians | 50.0 /100 | #174 | Average 79.6% |
| Cubans | 46.1 /100 | #175 | Average 79.5% |
| Australians | 46.0 /100 | #176 | Average 79.5% |