Fijian vs Laotian In Labor Force | Age 20-64
COMPARE
Fijian
Laotian
In Labor Force | Age 20-64
In Labor Force | Age 20-64 Comparison
Fijians
Laotians
78.4%
IN LABOR FORCE | AGE 20-64
0.1/ 100
METRIC RATING
262nd/ 347
METRIC RANK
79.6%
IN LABOR FORCE | AGE 20-64
58.4/ 100
METRIC RATING
169th/ 347
METRIC RANK
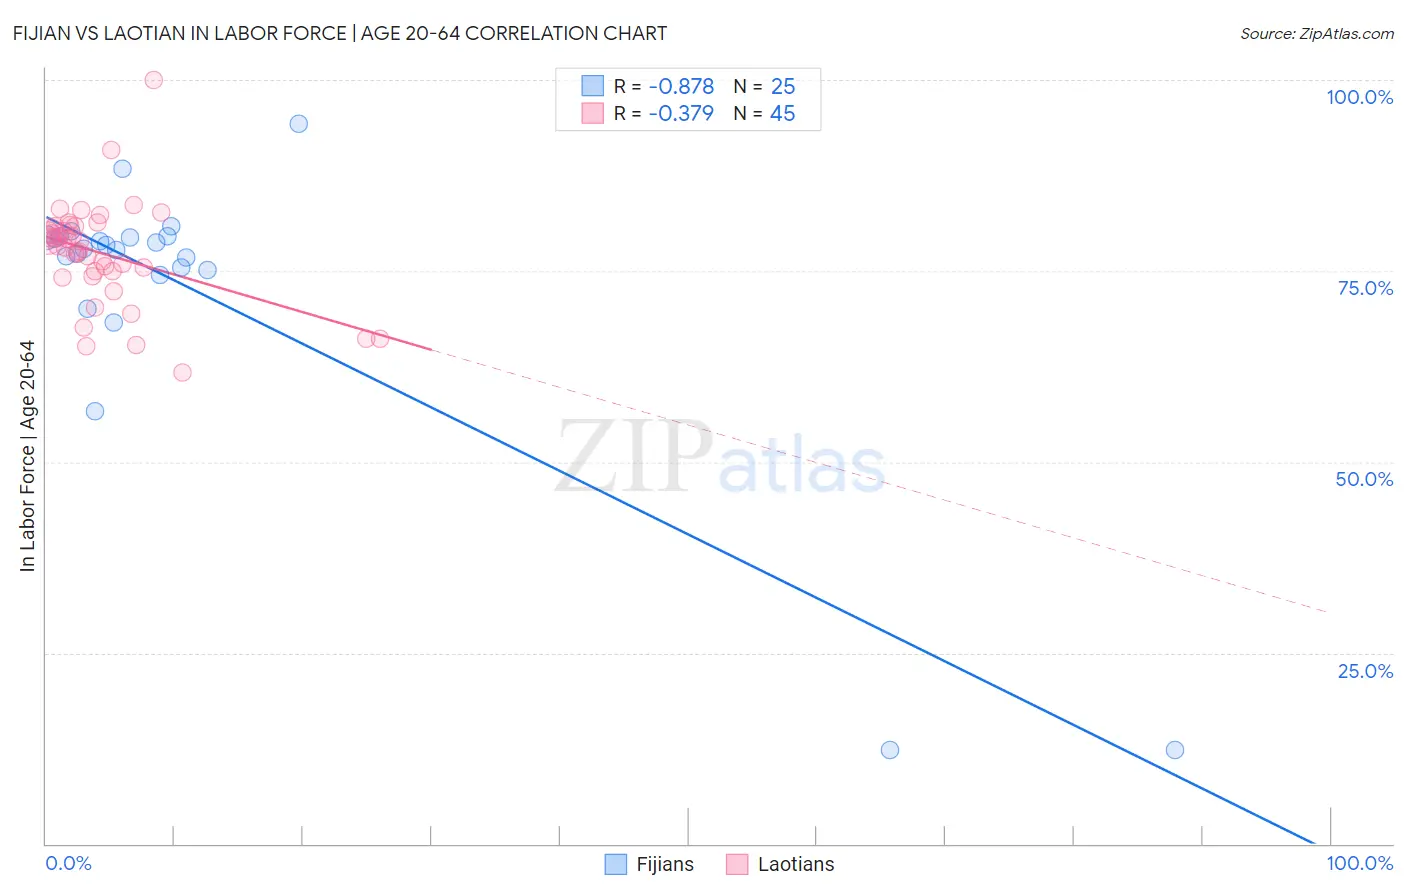
Fijian vs Laotian In Labor Force | Age 20-64 Correlation Chart
The statistical analysis conducted on geographies consisting of 55,948,069 people shows a very strong negative correlation between the proportion of Fijians and labor force participation rate among population between the ages 20 and 64 in the United States with a correlation coefficient (R) of -0.878 and weighted average of 78.4%. Similarly, the statistical analysis conducted on geographies consisting of 224,862,184 people shows a mild negative correlation between the proportion of Laotians and labor force participation rate among population between the ages 20 and 64 in the United States with a correlation coefficient (R) of -0.379 and weighted average of 79.6%, a difference of 1.5%.
In Labor Force | Age 20-64 Correlation Summary
| Measurement | Fijian | Laotian |
| Minimum | 12.2% | 61.7% |
| Maximum | 94.3% | 100.0% |
| Range | 82.1% | 38.3% |
| Mean | 72.3% | 77.3% |
| Median | 77.9% | 78.3% |
| Interquartile 25% (IQ1) | 74.8% | 74.7% |
| Interquartile 75% (IQ3) | 79.5% | 80.8% |
| Interquartile Range (IQR) | 4.7% | 6.2% |
| Standard Deviation (Sample) | 19.2% | 6.8% |
| Standard Deviation (Population) | 18.9% | 6.7% |
Similar Demographics by In Labor Force | Age 20-64
Demographics Similar to Fijians by In Labor Force | Age 20-64
In terms of in labor force | age 20-64, the demographic groups most similar to Fijians are Pennsylvania German (78.4%, a difference of 0.010%), Spaniard (78.4%, a difference of 0.020%), British West Indian (78.4%, a difference of 0.060%), Bahamian (78.4%, a difference of 0.060%), and U.S. Virgin Islander (78.4%, a difference of 0.080%).
| Demographics | Rating | Rank | In Labor Force | Age 20-64 |
| Hawaiians | 0.5 /100 | #255 | Tragic 78.7% |
| Celtics | 0.5 /100 | #256 | Tragic 78.7% |
| Guatemalans | 0.4 /100 | #257 | Tragic 78.7% |
| Immigrants | Guatemala | 0.4 /100 | #258 | Tragic 78.7% |
| Tsimshian | 0.4 /100 | #259 | Tragic 78.7% |
| Immigrants | Fiji | 0.3 /100 | #260 | Tragic 78.6% |
| Whites/Caucasians | 0.2 /100 | #261 | Tragic 78.5% |
| Fijians | 0.1 /100 | #262 | Tragic 78.4% |
| Pennsylvania Germans | 0.1 /100 | #263 | Tragic 78.4% |
| Spaniards | 0.1 /100 | #264 | Tragic 78.4% |
| British West Indians | 0.1 /100 | #265 | Tragic 78.4% |
| Bahamians | 0.1 /100 | #266 | Tragic 78.4% |
| U.S. Virgin Islanders | 0.1 /100 | #267 | Tragic 78.4% |
| West Indians | 0.0 /100 | #268 | Tragic 78.3% |
| Immigrants | Barbados | 0.0 /100 | #269 | Tragic 78.3% |
Demographics Similar to Laotians by In Labor Force | Age 20-64
In terms of in labor force | age 20-64, the demographic groups most similar to Laotians are Immigrants from Iraq (79.6%, a difference of 0.030%), Immigrants from Indonesia (79.6%, a difference of 0.030%), Okinawan (79.6%, a difference of 0.040%), Slavic (79.6%, a difference of 0.040%), and Immigrants from Switzerland (79.6%, a difference of 0.040%).
| Demographics | Rating | Rank | In Labor Force | Age 20-64 |
| Germans | 65.2 /100 | #162 | Good 79.7% |
| Immigrants | Costa Rica | 64.6 /100 | #163 | Good 79.7% |
| Immigrants | Burma/Myanmar | 64.4 /100 | #164 | Good 79.7% |
| Nigerians | 64.0 /100 | #165 | Good 79.7% |
| Okinawans | 62.7 /100 | #166 | Good 79.6% |
| Immigrants | Iraq | 62.0 /100 | #167 | Good 79.6% |
| Immigrants | Indonesia | 61.8 /100 | #168 | Good 79.6% |
| Laotians | 58.4 /100 | #169 | Average 79.6% |
| Slavs | 54.0 /100 | #170 | Average 79.6% |
| Immigrants | Switzerland | 53.3 /100 | #171 | Average 79.6% |
| Immigrants | Belgium | 53.1 /100 | #172 | Average 79.6% |
| Immigrants | Scotland | 52.4 /100 | #173 | Average 79.6% |
| Syrians | 50.0 /100 | #174 | Average 79.6% |
| Cubans | 46.1 /100 | #175 | Average 79.5% |
| Australians | 46.0 /100 | #176 | Average 79.5% |