Albanian vs Laotian In Labor Force | Age 20-64
COMPARE
Albanian
Laotian
In Labor Force | Age 20-64
In Labor Force | Age 20-64 Comparison
Albanians
Laotians
80.2%
IN LABOR FORCE | AGE 20-64
98.6/ 100
METRIC RATING
69th/ 347
METRIC RANK
79.6%
IN LABOR FORCE | AGE 20-64
58.4/ 100
METRIC RATING
169th/ 347
METRIC RANK
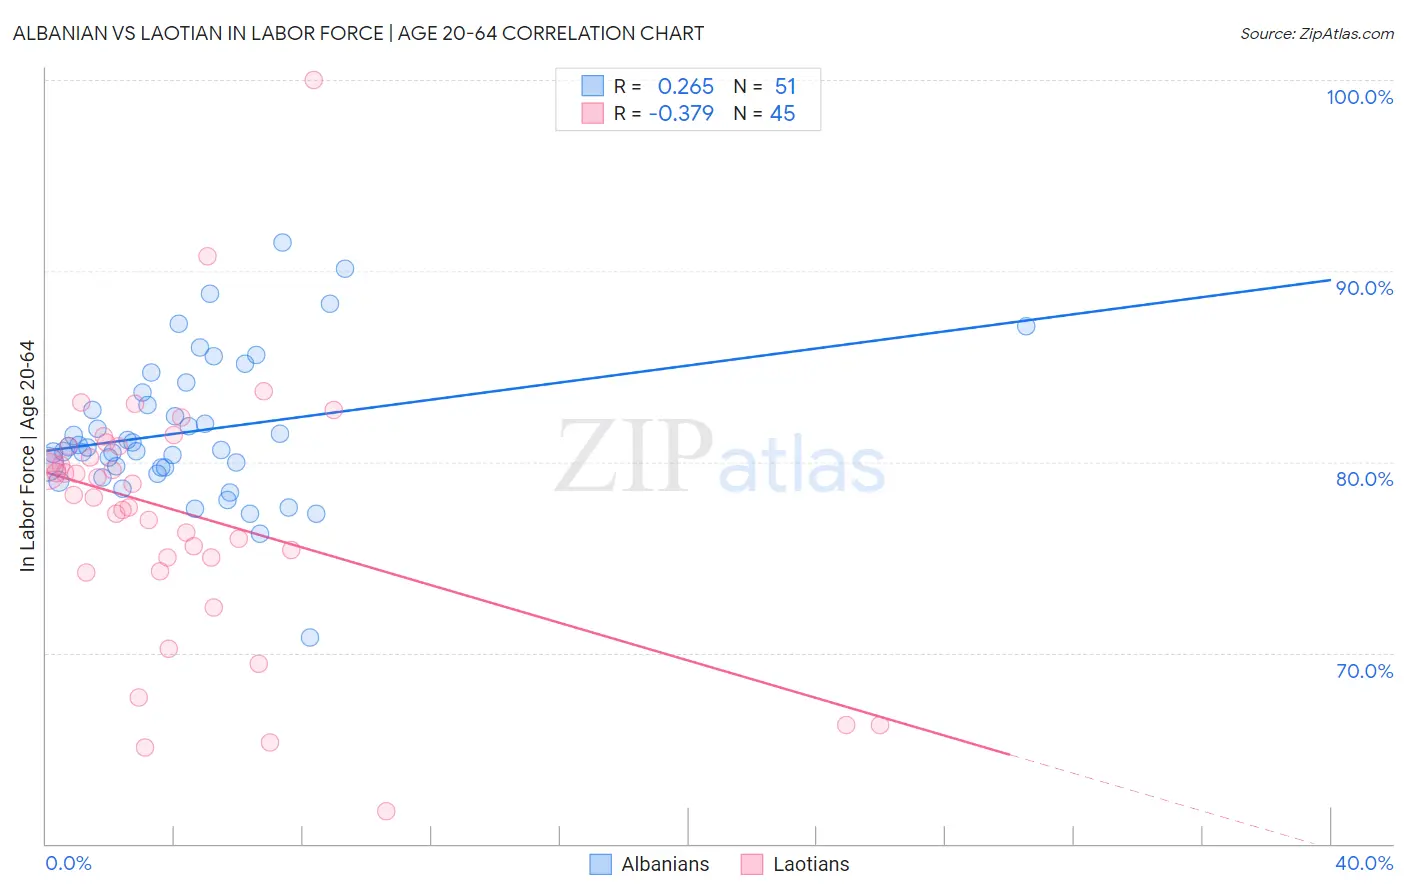
Albanian vs Laotian In Labor Force | Age 20-64 Correlation Chart
The statistical analysis conducted on geographies consisting of 193,264,914 people shows a weak positive correlation between the proportion of Albanians and labor force participation rate among population between the ages 20 and 64 in the United States with a correlation coefficient (R) of 0.265 and weighted average of 80.2%. Similarly, the statistical analysis conducted on geographies consisting of 224,862,184 people shows a mild negative correlation between the proportion of Laotians and labor force participation rate among population between the ages 20 and 64 in the United States with a correlation coefficient (R) of -0.379 and weighted average of 79.6%, a difference of 0.78%.
In Labor Force | Age 20-64 Correlation Summary
| Measurement | Albanian | Laotian |
| Minimum | 70.8% | 61.7% |
| Maximum | 91.5% | 100.0% |
| Range | 20.7% | 38.3% |
| Mean | 81.6% | 77.3% |
| Median | 80.8% | 78.3% |
| Interquartile 25% (IQ1) | 79.7% | 74.7% |
| Interquartile 75% (IQ3) | 83.7% | 80.8% |
| Interquartile Range (IQR) | 3.9% | 6.2% |
| Standard Deviation (Sample) | 3.8% | 6.8% |
| Standard Deviation (Population) | 3.7% | 6.7% |
Similar Demographics by In Labor Force | Age 20-64
Demographics Similar to Albanians by In Labor Force | Age 20-64
In terms of in labor force | age 20-64, the demographic groups most similar to Albanians are Bhutanese (80.2%, a difference of 0.0%), Immigrants from Turkey (80.2%, a difference of 0.0%), Macedonian (80.2%, a difference of 0.010%), Taiwanese (80.2%, a difference of 0.010%), and Soviet Union (80.2%, a difference of 0.010%).
| Demographics | Rating | Rank | In Labor Force | Age 20-64 |
| Carpatho Rusyns | 98.8 /100 | #62 | Exceptional 80.3% |
| Immigrants | Korea | 98.8 /100 | #63 | Exceptional 80.3% |
| Immigrants | Albania | 98.7 /100 | #64 | Exceptional 80.3% |
| Lithuanians | 98.7 /100 | #65 | Exceptional 80.2% |
| Macedonians | 98.7 /100 | #66 | Exceptional 80.2% |
| Taiwanese | 98.6 /100 | #67 | Exceptional 80.2% |
| Bhutanese | 98.6 /100 | #68 | Exceptional 80.2% |
| Albanians | 98.6 /100 | #69 | Exceptional 80.2% |
| Immigrants | Turkey | 98.5 /100 | #70 | Exceptional 80.2% |
| Soviet Union | 98.5 /100 | #71 | Exceptional 80.2% |
| Eastern Europeans | 98.4 /100 | #72 | Exceptional 80.2% |
| Cypriots | 98.2 /100 | #73 | Exceptional 80.2% |
| Immigrants | Eastern Europe | 98.1 /100 | #74 | Exceptional 80.2% |
| Immigrants | Afghanistan | 97.9 /100 | #75 | Exceptional 80.2% |
| Egyptians | 97.8 /100 | #76 | Exceptional 80.2% |
Demographics Similar to Laotians by In Labor Force | Age 20-64
In terms of in labor force | age 20-64, the demographic groups most similar to Laotians are Immigrants from Iraq (79.6%, a difference of 0.030%), Immigrants from Indonesia (79.6%, a difference of 0.030%), Okinawan (79.6%, a difference of 0.040%), Slavic (79.6%, a difference of 0.040%), and Immigrants from Switzerland (79.6%, a difference of 0.040%).
| Demographics | Rating | Rank | In Labor Force | Age 20-64 |
| Germans | 65.2 /100 | #162 | Good 79.7% |
| Immigrants | Costa Rica | 64.6 /100 | #163 | Good 79.7% |
| Immigrants | Burma/Myanmar | 64.4 /100 | #164 | Good 79.7% |
| Nigerians | 64.0 /100 | #165 | Good 79.7% |
| Okinawans | 62.7 /100 | #166 | Good 79.6% |
| Immigrants | Iraq | 62.0 /100 | #167 | Good 79.6% |
| Immigrants | Indonesia | 61.8 /100 | #168 | Good 79.6% |
| Laotians | 58.4 /100 | #169 | Average 79.6% |
| Slavs | 54.0 /100 | #170 | Average 79.6% |
| Immigrants | Switzerland | 53.3 /100 | #171 | Average 79.6% |
| Immigrants | Belgium | 53.1 /100 | #172 | Average 79.6% |
| Immigrants | Scotland | 52.4 /100 | #173 | Average 79.6% |
| Syrians | 50.0 /100 | #174 | Average 79.6% |
| Cubans | 46.1 /100 | #175 | Average 79.5% |
| Australians | 46.0 /100 | #176 | Average 79.5% |