Delaware vs Dutch In Labor Force | Age 20-64
COMPARE
Delaware
Dutch
In Labor Force | Age 20-64
In Labor Force | Age 20-64 Comparison
Delaware
Dutch
77.8%
IN LABOR FORCE | AGE 20-64
0.0/ 100
METRIC RATING
293rd/ 347
METRIC RANK
79.3%
IN LABOR FORCE | AGE 20-64
20.2/ 100
METRIC RATING
199th/ 347
METRIC RANK
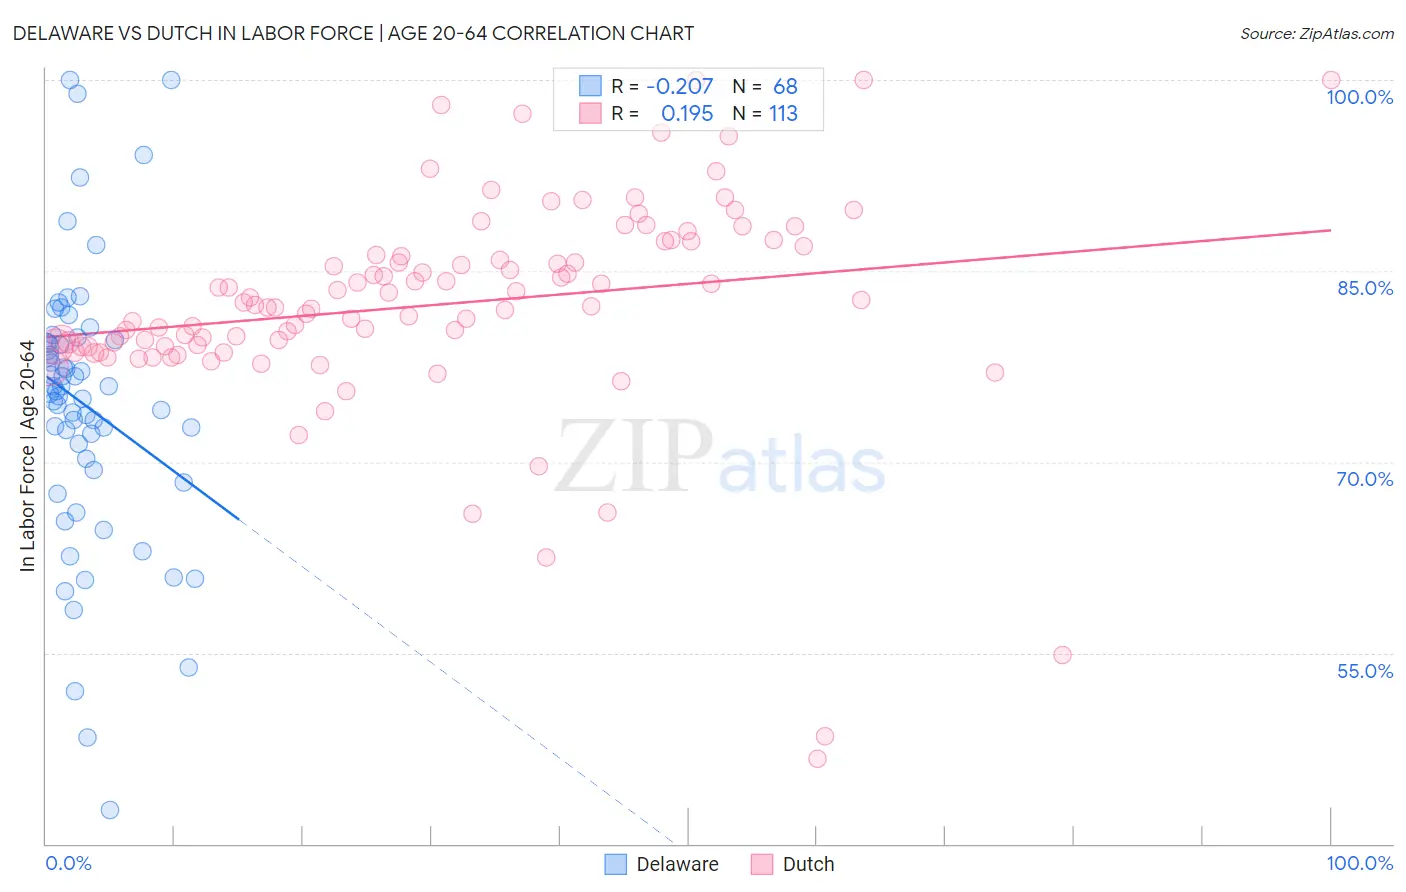
Delaware vs Dutch In Labor Force | Age 20-64 Correlation Chart
The statistical analysis conducted on geographies consisting of 96,240,999 people shows a weak negative correlation between the proportion of Delaware and labor force participation rate among population between the ages 20 and 64 in the United States with a correlation coefficient (R) of -0.207 and weighted average of 77.8%. Similarly, the statistical analysis conducted on geographies consisting of 554,361,515 people shows a poor positive correlation between the proportion of Dutch and labor force participation rate among population between the ages 20 and 64 in the United States with a correlation coefficient (R) of 0.195 and weighted average of 79.3%, a difference of 2.0%.
In Labor Force | Age 20-64 Correlation Summary
| Measurement | Delaware | Dutch |
| Minimum | 42.7% | 46.7% |
| Maximum | 100.0% | 100.0% |
| Range | 57.3% | 53.3% |
| Mean | 74.5% | 82.3% |
| Median | 75.4% | 82.2% |
| Interquartile 25% (IQ1) | 69.8% | 79.1% |
| Interquartile 75% (IQ3) | 79.5% | 86.6% |
| Interquartile Range (IQR) | 9.7% | 7.5% |
| Standard Deviation (Sample) | 10.9% | 8.4% |
| Standard Deviation (Population) | 10.8% | 8.4% |
Similar Demographics by In Labor Force | Age 20-64
Demographics Similar to Delaware by In Labor Force | Age 20-64
In terms of in labor force | age 20-64, the demographic groups most similar to Delaware are Immigrants from the Azores (77.8%, a difference of 0.040%), Spanish American (77.8%, a difference of 0.090%), Immigrants from Central America (77.7%, a difference of 0.090%), Immigrants from Grenada (77.7%, a difference of 0.12%), and Immigrants from Bangladesh (77.9%, a difference of 0.14%).
| Demographics | Rating | Rank | In Labor Force | Age 20-64 |
| Immigrants | Belize | 0.0 /100 | #286 | Tragic 78.0% |
| Vietnamese | 0.0 /100 | #287 | Tragic 78.0% |
| Hmong | 0.0 /100 | #288 | Tragic 77.9% |
| Africans | 0.0 /100 | #289 | Tragic 77.9% |
| Immigrants | Bangladesh | 0.0 /100 | #290 | Tragic 77.9% |
| Spanish Americans | 0.0 /100 | #291 | Tragic 77.8% |
| Immigrants | Azores | 0.0 /100 | #292 | Tragic 77.8% |
| Delaware | 0.0 /100 | #293 | Tragic 77.8% |
| Immigrants | Central America | 0.0 /100 | #294 | Tragic 77.7% |
| Immigrants | Grenada | 0.0 /100 | #295 | Tragic 77.7% |
| Immigrants | Dominican Republic | 0.0 /100 | #296 | Tragic 77.7% |
| Dominicans | 0.0 /100 | #297 | Tragic 77.7% |
| Cree | 0.0 /100 | #298 | Tragic 77.7% |
| Hispanics or Latinos | 0.0 /100 | #299 | Tragic 77.6% |
| Spanish American Indians | 0.0 /100 | #300 | Tragic 77.6% |
Demographics Similar to Dutch by In Labor Force | Age 20-64
In terms of in labor force | age 20-64, the demographic groups most similar to Dutch are Immigrants from Oceania (79.3%, a difference of 0.010%), Immigrants from Laos (79.4%, a difference of 0.020%), Immigrants from Nicaragua (79.3%, a difference of 0.020%), Nicaraguan (79.3%, a difference of 0.020%), and Immigrants from Senegal (79.4%, a difference of 0.030%).
| Demographics | Rating | Rank | In Labor Force | Age 20-64 |
| Immigrants | Denmark | 26.9 /100 | #192 | Fair 79.4% |
| Indonesians | 26.1 /100 | #193 | Fair 79.4% |
| Immigrants | Thailand | 24.8 /100 | #194 | Fair 79.4% |
| Immigrants | Austria | 23.7 /100 | #195 | Fair 79.4% |
| Ecuadorians | 23.1 /100 | #196 | Fair 79.4% |
| Immigrants | Senegal | 22.5 /100 | #197 | Fair 79.4% |
| Immigrants | Laos | 21.5 /100 | #198 | Fair 79.4% |
| Dutch | 20.2 /100 | #199 | Fair 79.3% |
| Immigrants | Oceania | 19.1 /100 | #200 | Poor 79.3% |
| Immigrants | Nicaragua | 19.0 /100 | #201 | Poor 79.3% |
| Nicaraguans | 18.3 /100 | #202 | Poor 79.3% |
| Iraqis | 17.7 /100 | #203 | Poor 79.3% |
| Immigrants | Cambodia | 17.6 /100 | #204 | Poor 79.3% |
| Immigrants | Congo | 17.5 /100 | #205 | Poor 79.3% |
| Immigrants | Ecuador | 16.9 /100 | #206 | Poor 79.3% |