Delaware vs Iranian In Labor Force | Age 20-64
COMPARE
Delaware
Iranian
In Labor Force | Age 20-64
In Labor Force | Age 20-64 Comparison
Delaware
Iranians
77.8%
IN LABOR FORCE | AGE 20-64
0.0/ 100
METRIC RATING
293rd/ 347
METRIC RANK
80.0%
IN LABOR FORCE | AGE 20-64
94.3/ 100
METRIC RATING
108th/ 347
METRIC RANK
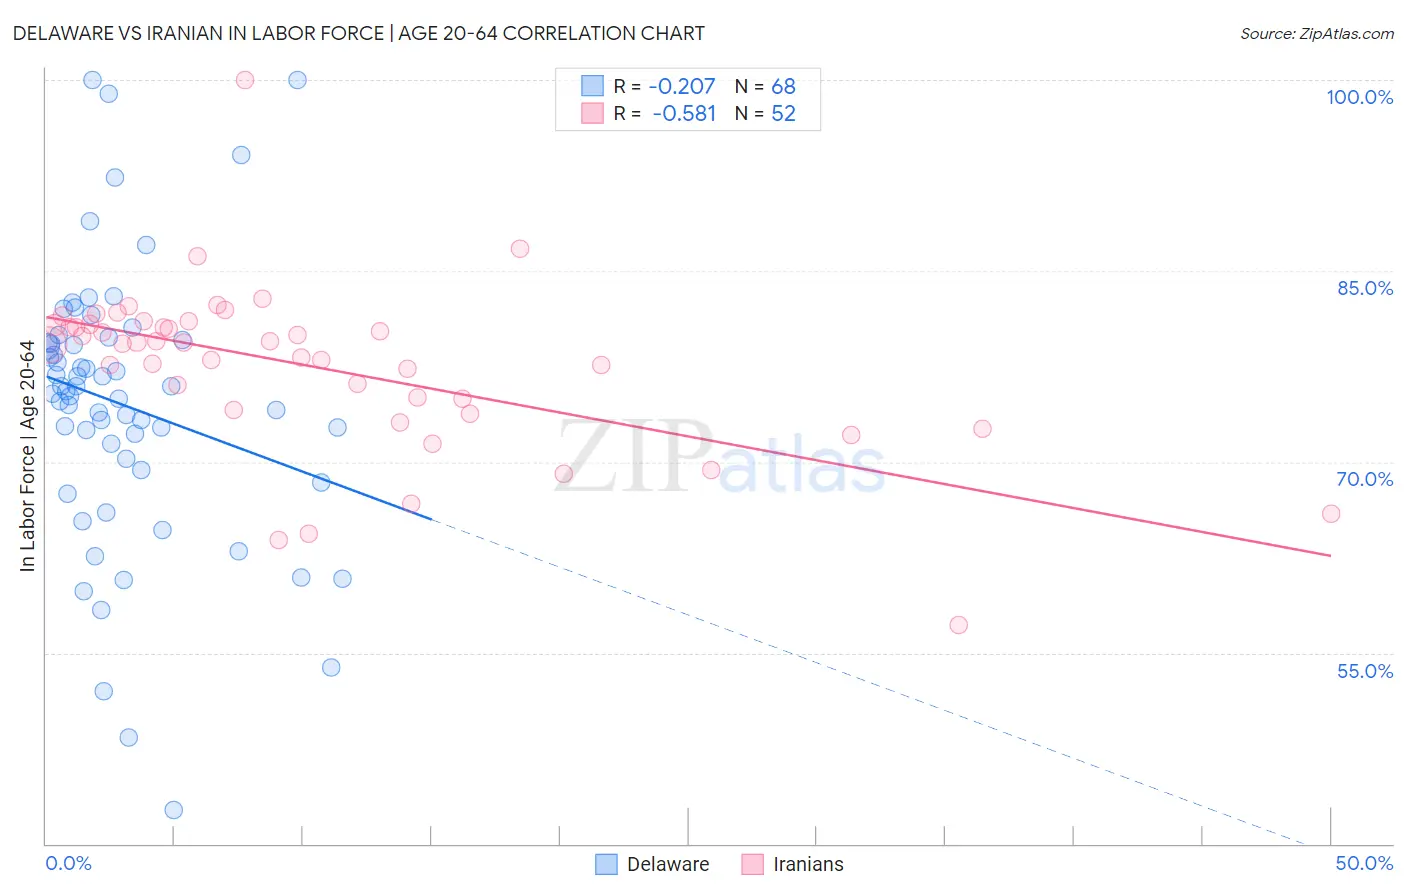
Delaware vs Iranian In Labor Force | Age 20-64 Correlation Chart
The statistical analysis conducted on geographies consisting of 96,240,999 people shows a weak negative correlation between the proportion of Delaware and labor force participation rate among population between the ages 20 and 64 in the United States with a correlation coefficient (R) of -0.207 and weighted average of 77.8%. Similarly, the statistical analysis conducted on geographies consisting of 316,908,203 people shows a substantial negative correlation between the proportion of Iranians and labor force participation rate among population between the ages 20 and 64 in the United States with a correlation coefficient (R) of -0.581 and weighted average of 80.0%, a difference of 2.9%.
In Labor Force | Age 20-64 Correlation Summary
| Measurement | Delaware | Iranian |
| Minimum | 42.7% | 57.2% |
| Maximum | 100.0% | 100.0% |
| Range | 57.3% | 42.8% |
| Mean | 74.5% | 77.5% |
| Median | 75.4% | 79.3% |
| Interquartile 25% (IQ1) | 69.8% | 74.5% |
| Interquartile 75% (IQ3) | 79.5% | 80.8% |
| Interquartile Range (IQR) | 9.7% | 6.3% |
| Standard Deviation (Sample) | 10.9% | 6.6% |
| Standard Deviation (Population) | 10.8% | 6.6% |
Similar Demographics by In Labor Force | Age 20-64
Demographics Similar to Delaware by In Labor Force | Age 20-64
In terms of in labor force | age 20-64, the demographic groups most similar to Delaware are Immigrants from the Azores (77.8%, a difference of 0.040%), Spanish American (77.8%, a difference of 0.090%), Immigrants from Central America (77.7%, a difference of 0.090%), Immigrants from Grenada (77.7%, a difference of 0.12%), and Immigrants from Bangladesh (77.9%, a difference of 0.14%).
| Demographics | Rating | Rank | In Labor Force | Age 20-64 |
| Immigrants | Belize | 0.0 /100 | #286 | Tragic 78.0% |
| Vietnamese | 0.0 /100 | #287 | Tragic 78.0% |
| Hmong | 0.0 /100 | #288 | Tragic 77.9% |
| Africans | 0.0 /100 | #289 | Tragic 77.9% |
| Immigrants | Bangladesh | 0.0 /100 | #290 | Tragic 77.9% |
| Spanish Americans | 0.0 /100 | #291 | Tragic 77.8% |
| Immigrants | Azores | 0.0 /100 | #292 | Tragic 77.8% |
| Delaware | 0.0 /100 | #293 | Tragic 77.8% |
| Immigrants | Central America | 0.0 /100 | #294 | Tragic 77.7% |
| Immigrants | Grenada | 0.0 /100 | #295 | Tragic 77.7% |
| Immigrants | Dominican Republic | 0.0 /100 | #296 | Tragic 77.7% |
| Dominicans | 0.0 /100 | #297 | Tragic 77.7% |
| Cree | 0.0 /100 | #298 | Tragic 77.7% |
| Hispanics or Latinos | 0.0 /100 | #299 | Tragic 77.6% |
| Spanish American Indians | 0.0 /100 | #300 | Tragic 77.6% |
Demographics Similar to Iranians by In Labor Force | Age 20-64
In terms of in labor force | age 20-64, the demographic groups most similar to Iranians are Immigrants from Argentina (80.0%, a difference of 0.010%), Estonian (80.0%, a difference of 0.010%), Immigrants from South America (80.0%, a difference of 0.010%), Immigrants from Italy (80.0%, a difference of 0.010%), and Greek (80.0%, a difference of 0.020%).
| Demographics | Rating | Rank | In Labor Force | Age 20-64 |
| Palestinians | 95.5 /100 | #101 | Exceptional 80.0% |
| Immigrants | Australia | 95.5 /100 | #102 | Exceptional 80.0% |
| Russians | 95.5 /100 | #103 | Exceptional 80.0% |
| Venezuelans | 95.3 /100 | #104 | Exceptional 80.0% |
| Immigrants | Ghana | 95.0 /100 | #105 | Exceptional 80.0% |
| Greeks | 94.8 /100 | #106 | Exceptional 80.0% |
| Immigrants | Jordan | 94.8 /100 | #107 | Exceptional 80.0% |
| Iranians | 94.3 /100 | #108 | Exceptional 80.0% |
| Immigrants | Argentina | 94.1 /100 | #109 | Exceptional 80.0% |
| Estonians | 94.0 /100 | #110 | Exceptional 80.0% |
| Immigrants | South America | 93.9 /100 | #111 | Exceptional 80.0% |
| Immigrants | Italy | 93.9 /100 | #112 | Exceptional 80.0% |
| Sri Lankans | 93.9 /100 | #113 | Exceptional 80.0% |
| Argentineans | 93.8 /100 | #114 | Exceptional 80.0% |
| Bermudans | 93.3 /100 | #115 | Exceptional 80.0% |