Dutch vs Laotian In Labor Force | Age 20-64
COMPARE
Dutch
Laotian
In Labor Force | Age 20-64
In Labor Force | Age 20-64 Comparison
Dutch
Laotians
79.3%
IN LABOR FORCE | AGE 20-64
20.2/ 100
METRIC RATING
199th/ 347
METRIC RANK
79.6%
IN LABOR FORCE | AGE 20-64
58.4/ 100
METRIC RATING
169th/ 347
METRIC RANK
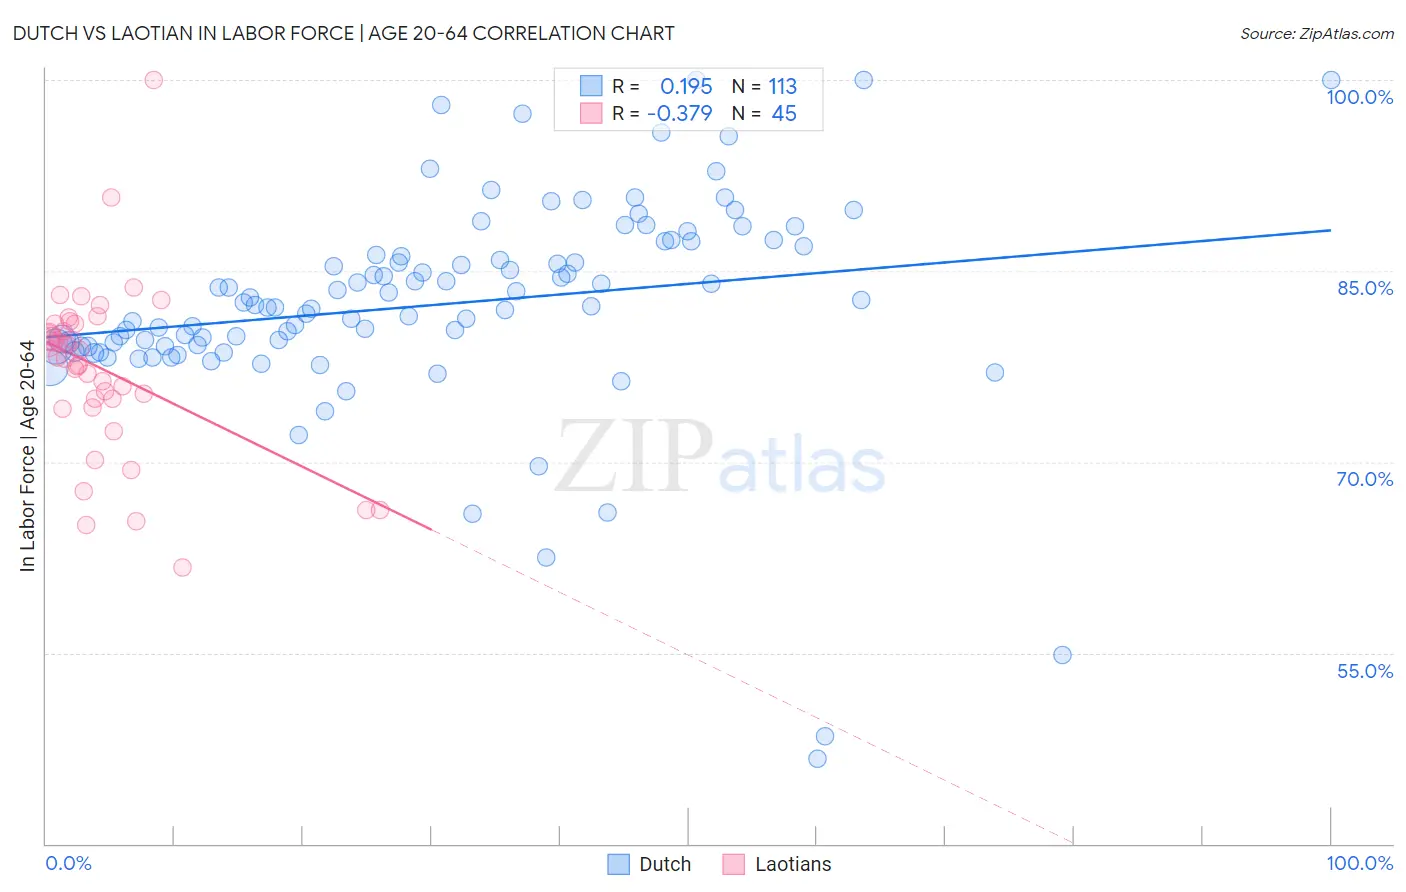
Dutch vs Laotian In Labor Force | Age 20-64 Correlation Chart
The statistical analysis conducted on geographies consisting of 554,361,515 people shows a poor positive correlation between the proportion of Dutch and labor force participation rate among population between the ages 20 and 64 in the United States with a correlation coefficient (R) of 0.195 and weighted average of 79.3%. Similarly, the statistical analysis conducted on geographies consisting of 224,862,184 people shows a mild negative correlation between the proportion of Laotians and labor force participation rate among population between the ages 20 and 64 in the United States with a correlation coefficient (R) of -0.379 and weighted average of 79.6%, a difference of 0.35%.
In Labor Force | Age 20-64 Correlation Summary
| Measurement | Dutch | Laotian |
| Minimum | 46.7% | 61.7% |
| Maximum | 100.0% | 100.0% |
| Range | 53.3% | 38.3% |
| Mean | 82.3% | 77.3% |
| Median | 82.2% | 78.3% |
| Interquartile 25% (IQ1) | 79.1% | 74.7% |
| Interquartile 75% (IQ3) | 86.6% | 80.8% |
| Interquartile Range (IQR) | 7.5% | 6.2% |
| Standard Deviation (Sample) | 8.4% | 6.8% |
| Standard Deviation (Population) | 8.4% | 6.7% |
Similar Demographics by In Labor Force | Age 20-64
Demographics Similar to Dutch by In Labor Force | Age 20-64
In terms of in labor force | age 20-64, the demographic groups most similar to Dutch are Immigrants from Oceania (79.3%, a difference of 0.010%), Immigrants from Laos (79.4%, a difference of 0.020%), Immigrants from Nicaragua (79.3%, a difference of 0.020%), Nicaraguan (79.3%, a difference of 0.020%), and Immigrants from Senegal (79.4%, a difference of 0.030%).
| Demographics | Rating | Rank | In Labor Force | Age 20-64 |
| Immigrants | Denmark | 26.9 /100 | #192 | Fair 79.4% |
| Indonesians | 26.1 /100 | #193 | Fair 79.4% |
| Immigrants | Thailand | 24.8 /100 | #194 | Fair 79.4% |
| Immigrants | Austria | 23.7 /100 | #195 | Fair 79.4% |
| Ecuadorians | 23.1 /100 | #196 | Fair 79.4% |
| Immigrants | Senegal | 22.5 /100 | #197 | Fair 79.4% |
| Immigrants | Laos | 21.5 /100 | #198 | Fair 79.4% |
| Dutch | 20.2 /100 | #199 | Fair 79.3% |
| Immigrants | Oceania | 19.1 /100 | #200 | Poor 79.3% |
| Immigrants | Nicaragua | 19.0 /100 | #201 | Poor 79.3% |
| Nicaraguans | 18.3 /100 | #202 | Poor 79.3% |
| Iraqis | 17.7 /100 | #203 | Poor 79.3% |
| Immigrants | Cambodia | 17.6 /100 | #204 | Poor 79.3% |
| Immigrants | Congo | 17.5 /100 | #205 | Poor 79.3% |
| Immigrants | Ecuador | 16.9 /100 | #206 | Poor 79.3% |
Demographics Similar to Laotians by In Labor Force | Age 20-64
In terms of in labor force | age 20-64, the demographic groups most similar to Laotians are Immigrants from Iraq (79.6%, a difference of 0.030%), Immigrants from Indonesia (79.6%, a difference of 0.030%), Okinawan (79.6%, a difference of 0.040%), Slavic (79.6%, a difference of 0.040%), and Immigrants from Switzerland (79.6%, a difference of 0.040%).
| Demographics | Rating | Rank | In Labor Force | Age 20-64 |
| Germans | 65.2 /100 | #162 | Good 79.7% |
| Immigrants | Costa Rica | 64.6 /100 | #163 | Good 79.7% |
| Immigrants | Burma/Myanmar | 64.4 /100 | #164 | Good 79.7% |
| Nigerians | 64.0 /100 | #165 | Good 79.7% |
| Okinawans | 62.7 /100 | #166 | Good 79.6% |
| Immigrants | Iraq | 62.0 /100 | #167 | Good 79.6% |
| Immigrants | Indonesia | 61.8 /100 | #168 | Good 79.6% |
| Laotians | 58.4 /100 | #169 | Average 79.6% |
| Slavs | 54.0 /100 | #170 | Average 79.6% |
| Immigrants | Switzerland | 53.3 /100 | #171 | Average 79.6% |
| Immigrants | Belgium | 53.1 /100 | #172 | Average 79.6% |
| Immigrants | Scotland | 52.4 /100 | #173 | Average 79.6% |
| Syrians | 50.0 /100 | #174 | Average 79.6% |
| Cubans | 46.1 /100 | #175 | Average 79.5% |
| Australians | 46.0 /100 | #176 | Average 79.5% |