Delaware vs Honduran In Labor Force | Age 20-64
COMPARE
Delaware
Honduran
In Labor Force | Age 20-64
In Labor Force | Age 20-64 Comparison
Delaware
Hondurans
77.8%
IN LABOR FORCE | AGE 20-64
0.0/ 100
METRIC RATING
293rd/ 347
METRIC RANK
78.8%
IN LABOR FORCE | AGE 20-64
0.8/ 100
METRIC RATING
250th/ 347
METRIC RANK
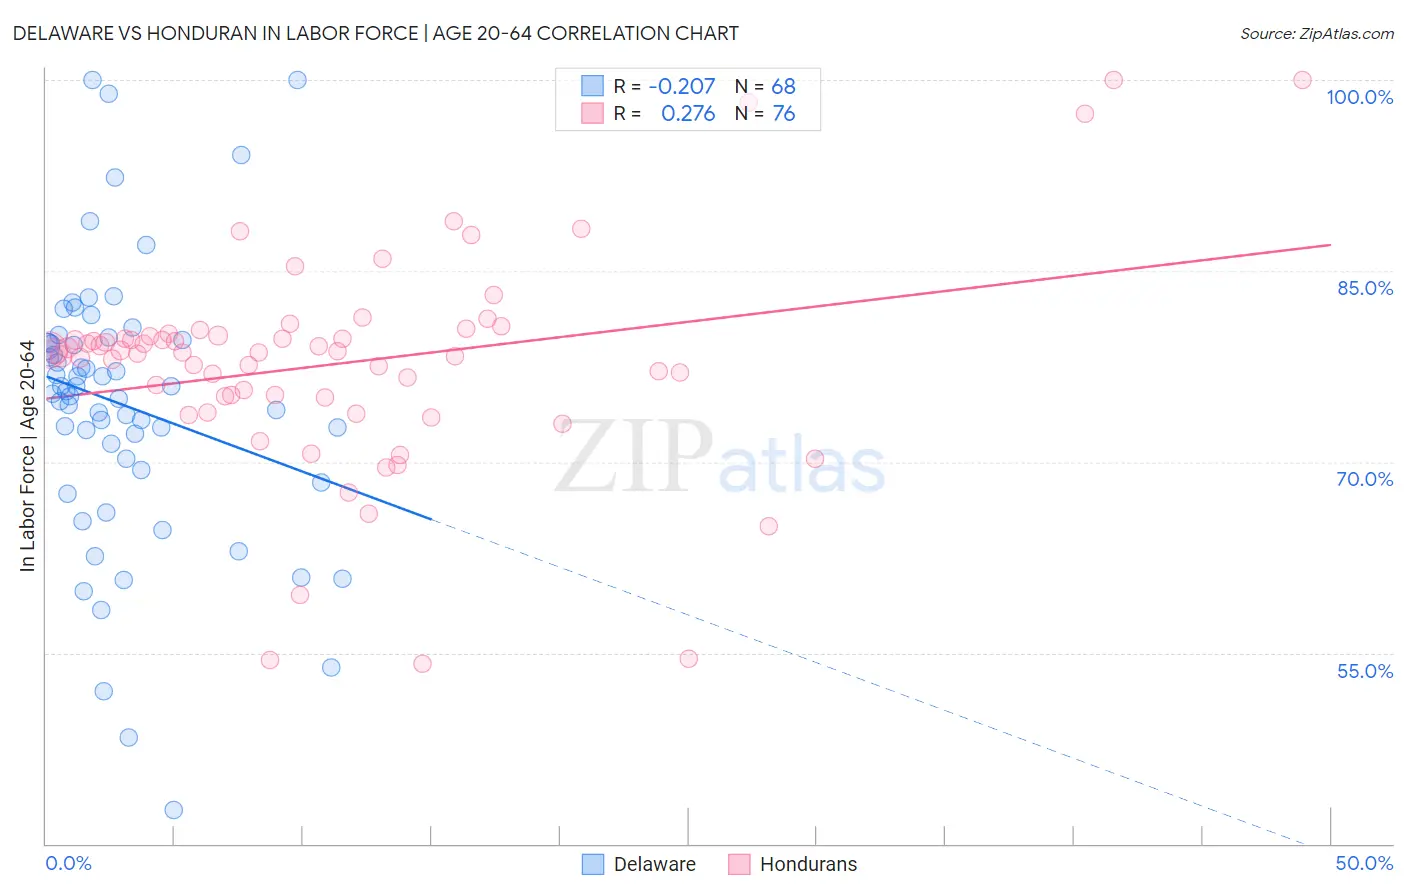
Delaware vs Honduran In Labor Force | Age 20-64 Correlation Chart
The statistical analysis conducted on geographies consisting of 96,240,999 people shows a weak negative correlation between the proportion of Delaware and labor force participation rate among population between the ages 20 and 64 in the United States with a correlation coefficient (R) of -0.207 and weighted average of 77.8%. Similarly, the statistical analysis conducted on geographies consisting of 357,847,494 people shows a weak positive correlation between the proportion of Hondurans and labor force participation rate among population between the ages 20 and 64 in the United States with a correlation coefficient (R) of 0.276 and weighted average of 78.8%, a difference of 1.3%.
In Labor Force | Age 20-64 Correlation Summary
| Measurement | Delaware | Honduran |
| Minimum | 42.7% | 54.2% |
| Maximum | 100.0% | 100.0% |
| Range | 57.3% | 45.8% |
| Mean | 74.5% | 77.7% |
| Median | 75.4% | 78.6% |
| Interquartile 25% (IQ1) | 69.8% | 75.1% |
| Interquartile 75% (IQ3) | 79.5% | 79.9% |
| Interquartile Range (IQR) | 9.7% | 4.8% |
| Standard Deviation (Sample) | 10.9% | 8.4% |
| Standard Deviation (Population) | 10.8% | 8.4% |
Similar Demographics by In Labor Force | Age 20-64
Demographics Similar to Delaware by In Labor Force | Age 20-64
In terms of in labor force | age 20-64, the demographic groups most similar to Delaware are Immigrants from the Azores (77.8%, a difference of 0.040%), Spanish American (77.8%, a difference of 0.090%), Immigrants from Central America (77.7%, a difference of 0.090%), Immigrants from Grenada (77.7%, a difference of 0.12%), and Immigrants from Bangladesh (77.9%, a difference of 0.14%).
| Demographics | Rating | Rank | In Labor Force | Age 20-64 |
| Immigrants | Belize | 0.0 /100 | #286 | Tragic 78.0% |
| Vietnamese | 0.0 /100 | #287 | Tragic 78.0% |
| Hmong | 0.0 /100 | #288 | Tragic 77.9% |
| Africans | 0.0 /100 | #289 | Tragic 77.9% |
| Immigrants | Bangladesh | 0.0 /100 | #290 | Tragic 77.9% |
| Spanish Americans | 0.0 /100 | #291 | Tragic 77.8% |
| Immigrants | Azores | 0.0 /100 | #292 | Tragic 77.8% |
| Delaware | 0.0 /100 | #293 | Tragic 77.8% |
| Immigrants | Central America | 0.0 /100 | #294 | Tragic 77.7% |
| Immigrants | Grenada | 0.0 /100 | #295 | Tragic 77.7% |
| Immigrants | Dominican Republic | 0.0 /100 | #296 | Tragic 77.7% |
| Dominicans | 0.0 /100 | #297 | Tragic 77.7% |
| Cree | 0.0 /100 | #298 | Tragic 77.7% |
| Hispanics or Latinos | 0.0 /100 | #299 | Tragic 77.6% |
| Spanish American Indians | 0.0 /100 | #300 | Tragic 77.6% |
Demographics Similar to Hondurans by In Labor Force | Age 20-64
In terms of in labor force | age 20-64, the demographic groups most similar to Hondurans are English (78.8%, a difference of 0.0%), Immigrants from Caribbean (78.8%, a difference of 0.030%), Barbadian (78.8%, a difference of 0.030%), Immigrants from Germany (78.8%, a difference of 0.040%), and Immigrants from Trinidad and Tobago (78.8%, a difference of 0.060%).
| Demographics | Rating | Rank | In Labor Force | Age 20-64 |
| Immigrants | West Indies | 1.7 /100 | #243 | Tragic 78.9% |
| French | 1.5 /100 | #244 | Tragic 78.9% |
| Scottish | 1.3 /100 | #245 | Tragic 78.9% |
| Immigrants | Trinidad and Tobago | 1.1 /100 | #246 | Tragic 78.8% |
| Immigrants | Germany | 1.0 /100 | #247 | Tragic 78.8% |
| Immigrants | Caribbean | 1.0 /100 | #248 | Tragic 78.8% |
| English | 0.9 /100 | #249 | Tragic 78.8% |
| Hondurans | 0.8 /100 | #250 | Tragic 78.8% |
| Barbadians | 0.7 /100 | #251 | Tragic 78.8% |
| Immigrants | Honduras | 0.6 /100 | #252 | Tragic 78.7% |
| Basques | 0.5 /100 | #253 | Tragic 78.7% |
| Immigrants | Lebanon | 0.5 /100 | #254 | Tragic 78.7% |
| Hawaiians | 0.5 /100 | #255 | Tragic 78.7% |
| Celtics | 0.5 /100 | #256 | Tragic 78.7% |
| Guatemalans | 0.4 /100 | #257 | Tragic 78.7% |