Delaware vs Barbadian In Labor Force | Age 45-54
COMPARE
Delaware
Barbadian
In Labor Force | Age 45-54
In Labor Force | Age 45-54 Comparison
Delaware
Barbadians
80.8%
IN LABOR FORCE | AGE 45-54
0.0/ 100
METRIC RATING
285th/ 347
METRIC RANK
81.6%
IN LABOR FORCE | AGE 45-54
0.1/ 100
METRIC RATING
256th/ 347
METRIC RANK
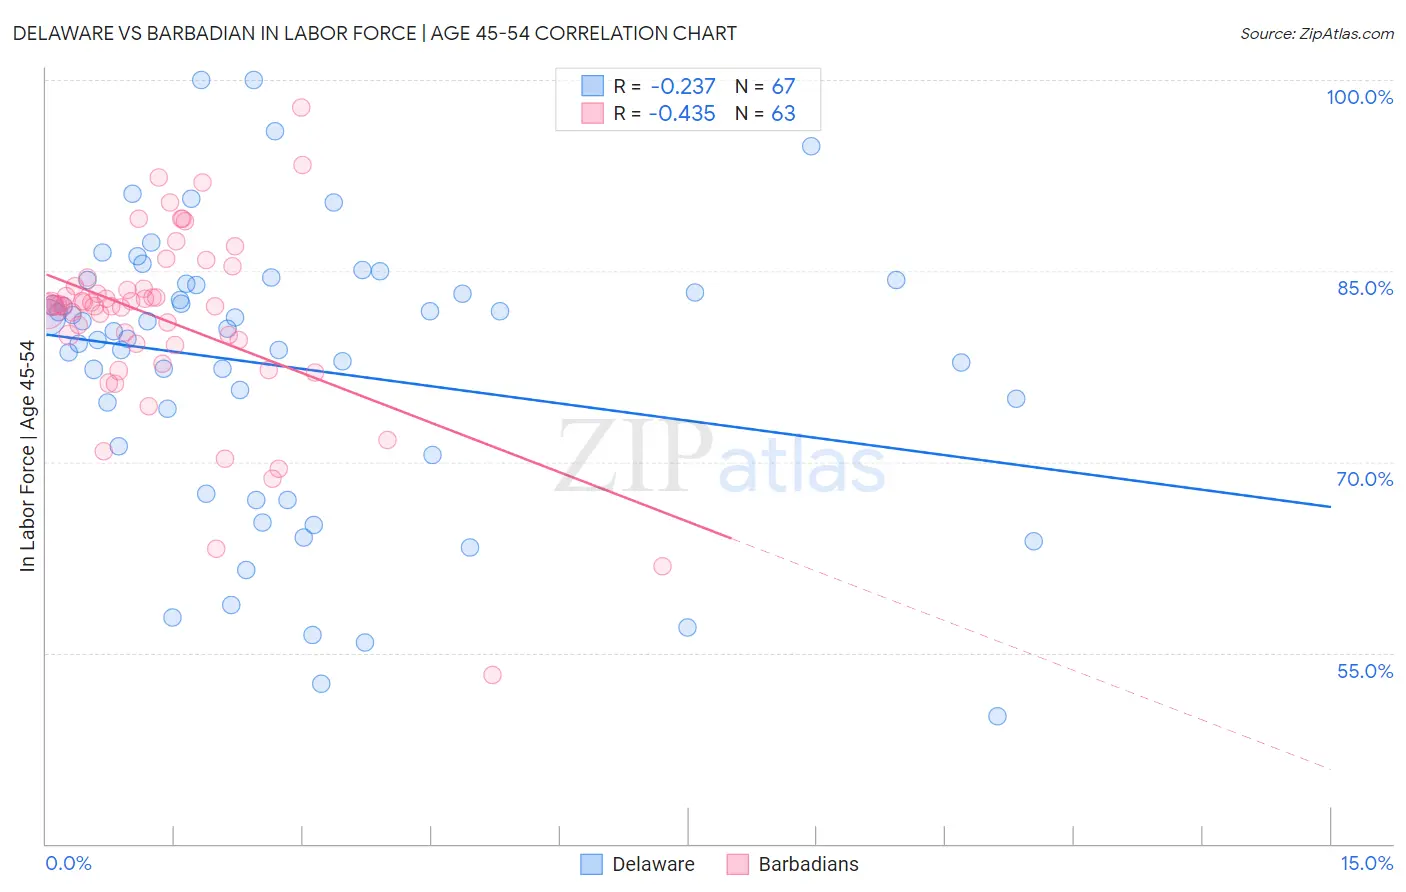
Delaware vs Barbadian In Labor Force | Age 45-54 Correlation Chart
The statistical analysis conducted on geographies consisting of 96,219,228 people shows a weak negative correlation between the proportion of Delaware and labor force participation rate among population between the ages 45 and 54 in the United States with a correlation coefficient (R) of -0.237 and weighted average of 80.8%. Similarly, the statistical analysis conducted on geographies consisting of 141,264,705 people shows a moderate negative correlation between the proportion of Barbadians and labor force participation rate among population between the ages 45 and 54 in the United States with a correlation coefficient (R) of -0.435 and weighted average of 81.6%, a difference of 0.98%.
In Labor Force | Age 45-54 Correlation Summary
| Measurement | Delaware | Barbadian |
| Minimum | 50.0% | 53.3% |
| Maximum | 100.0% | 97.8% |
| Range | 50.0% | 44.5% |
| Mean | 77.4% | 81.1% |
| Median | 80.2% | 82.3% |
| Interquartile 25% (IQ1) | 70.5% | 79.2% |
| Interquartile 75% (IQ3) | 84.0% | 83.8% |
| Interquartile Range (IQR) | 13.5% | 4.6% |
| Standard Deviation (Sample) | 11.1% | 7.5% |
| Standard Deviation (Population) | 11.0% | 7.4% |
Similar Demographics by In Labor Force | Age 45-54
Demographics Similar to Delaware by In Labor Force | Age 45-54
In terms of in labor force | age 45-54, the demographic groups most similar to Delaware are Belizean (80.8%, a difference of 0.010%), Immigrants from Dominica (80.8%, a difference of 0.010%), Vietnamese (80.8%, a difference of 0.010%), Cree (80.8%, a difference of 0.010%), and Immigrants from Bangladesh (80.7%, a difference of 0.040%).
| Demographics | Rating | Rank | In Labor Force | Age 45-54 |
| Immigrants | Guatemala | 0.0 /100 | #278 | Tragic 81.1% |
| Immigrants | Micronesia | 0.0 /100 | #279 | Tragic 81.1% |
| Immigrants | Latin America | 0.0 /100 | #280 | Tragic 81.0% |
| Immigrants | Grenada | 0.0 /100 | #281 | Tragic 81.0% |
| Aleuts | 0.0 /100 | #282 | Tragic 81.0% |
| French American Indians | 0.0 /100 | #283 | Tragic 80.8% |
| Belizeans | 0.0 /100 | #284 | Tragic 80.8% |
| Delaware | 0.0 /100 | #285 | Tragic 80.8% |
| Immigrants | Dominica | 0.0 /100 | #286 | Tragic 80.8% |
| Vietnamese | 0.0 /100 | #287 | Tragic 80.8% |
| Cree | 0.0 /100 | #288 | Tragic 80.8% |
| Immigrants | Bangladesh | 0.0 /100 | #289 | Tragic 80.7% |
| Mexican American Indians | 0.0 /100 | #290 | Tragic 80.7% |
| Immigrants | Belize | 0.0 /100 | #291 | Tragic 80.6% |
| Iroquois | 0.0 /100 | #292 | Tragic 80.6% |
Demographics Similar to Barbadians by In Labor Force | Age 45-54
In terms of in labor force | age 45-54, the demographic groups most similar to Barbadians are Immigrants from Congo (81.6%, a difference of 0.020%), Scotch-Irish (81.6%, a difference of 0.030%), Immigrants from Fiji (81.5%, a difference of 0.030%), Immigrants from Laos (81.6%, a difference of 0.040%), and Guyanese (81.5%, a difference of 0.040%).
| Demographics | Rating | Rank | In Labor Force | Age 45-54 |
| Hmong | 0.3 /100 | #249 | Tragic 81.7% |
| Immigrants | Armenia | 0.2 /100 | #250 | Tragic 81.7% |
| Guamanians/Chamorros | 0.2 /100 | #251 | Tragic 81.6% |
| Pennsylvania Germans | 0.2 /100 | #252 | Tragic 81.6% |
| Japanese | 0.2 /100 | #253 | Tragic 81.6% |
| Immigrants | Laos | 0.2 /100 | #254 | Tragic 81.6% |
| Scotch-Irish | 0.2 /100 | #255 | Tragic 81.6% |
| Barbadians | 0.1 /100 | #256 | Tragic 81.6% |
| Immigrants | Congo | 0.1 /100 | #257 | Tragic 81.6% |
| Immigrants | Fiji | 0.1 /100 | #258 | Tragic 81.5% |
| Guyanese | 0.1 /100 | #259 | Tragic 81.5% |
| Spaniards | 0.1 /100 | #260 | Tragic 81.5% |
| Hawaiians | 0.1 /100 | #261 | Tragic 81.5% |
| Immigrants | Guyana | 0.1 /100 | #262 | Tragic 81.5% |
| Indonesians | 0.1 /100 | #263 | Tragic 81.5% |