Malaysian vs Immigrants from Sweden In Labor Force | Age 45-54
COMPARE
Malaysian
Immigrants from Sweden
In Labor Force | Age 45-54
In Labor Force | Age 45-54 Comparison
Malaysians
Immigrants from Sweden
82.0%
IN LABOR FORCE | AGE 45-54
1.7/ 100
METRIC RATING
233rd/ 347
METRIC RANK
82.9%
IN LABOR FORCE | AGE 45-54
73.3/ 100
METRIC RATING
149th/ 347
METRIC RANK
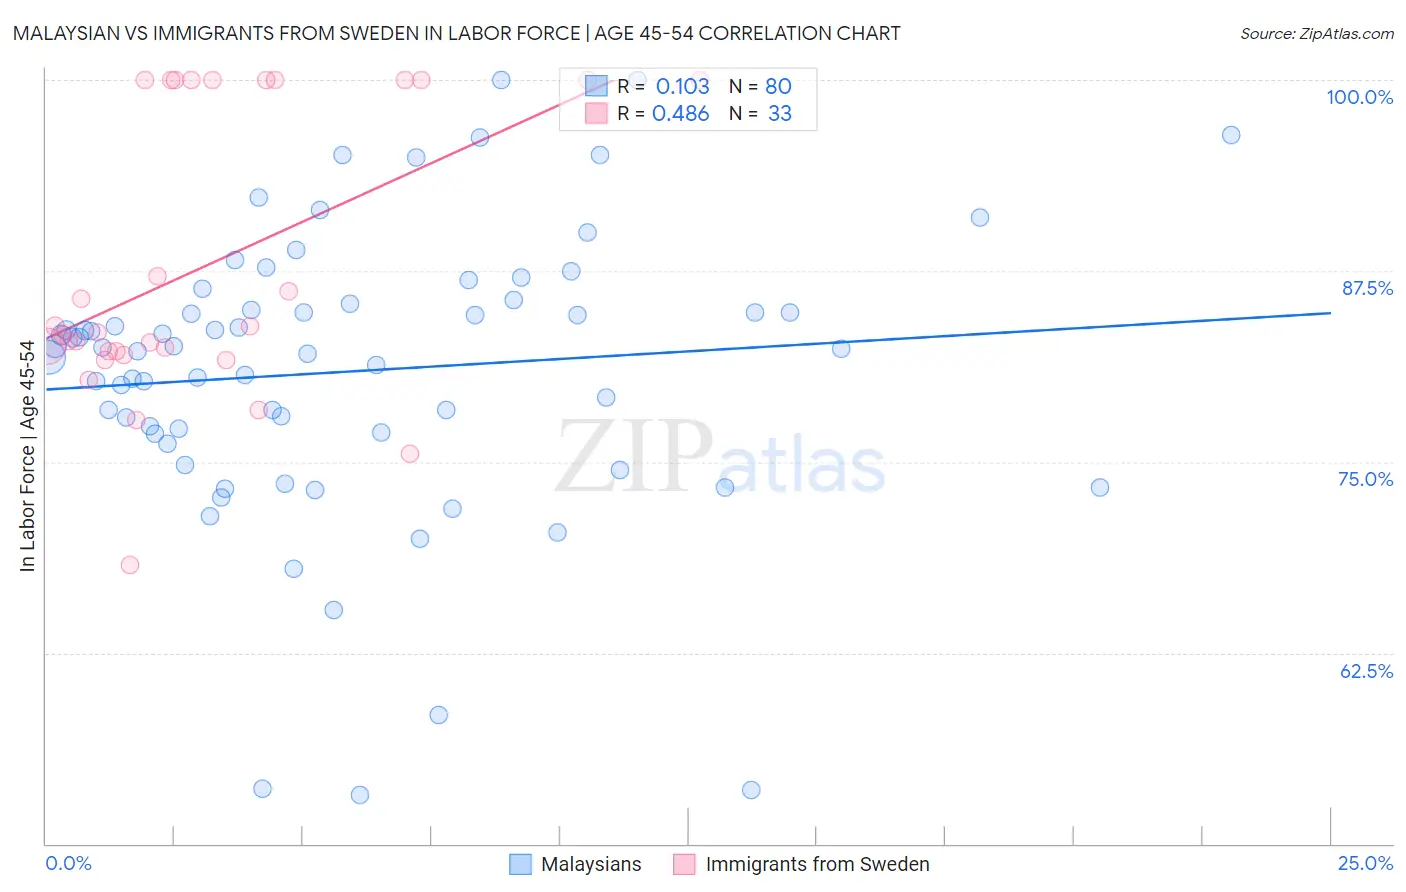
Malaysian vs Immigrants from Sweden In Labor Force | Age 45-54 Correlation Chart
The statistical analysis conducted on geographies consisting of 226,006,584 people shows a poor positive correlation between the proportion of Malaysians and labor force participation rate among population between the ages 45 and 54 in the United States with a correlation coefficient (R) of 0.103 and weighted average of 82.0%. Similarly, the statistical analysis conducted on geographies consisting of 164,697,999 people shows a moderate positive correlation between the proportion of Immigrants from Sweden and labor force participation rate among population between the ages 45 and 54 in the United States with a correlation coefficient (R) of 0.486 and weighted average of 82.9%, a difference of 1.1%.
In Labor Force | Age 45-54 Correlation Summary
| Measurement | Malaysian | Immigrants from Sweden |
| Minimum | 53.2% | 68.3% |
| Maximum | 100.0% | 100.0% |
| Range | 46.8% | 31.7% |
| Mean | 80.9% | 87.8% |
| Median | 82.4% | 83.5% |
| Interquartile 25% (IQ1) | 76.9% | 82.1% |
| Interquartile 75% (IQ3) | 85.1% | 100.0% |
| Interquartile Range (IQR) | 8.3% | 17.9% |
| Standard Deviation (Sample) | 9.3% | 9.3% |
| Standard Deviation (Population) | 9.3% | 9.2% |
Similar Demographics by In Labor Force | Age 45-54
Demographics Similar to Malaysians by In Labor Force | Age 45-54
In terms of in labor force | age 45-54, the demographic groups most similar to Malaysians are Immigrants from Portugal (82.0%, a difference of 0.0%), Salvadoran (82.0%, a difference of 0.0%), Immigrants from Senegal (82.0%, a difference of 0.010%), Jamaican (82.0%, a difference of 0.020%), and Immigrants from Burma/Myanmar (82.0%, a difference of 0.030%).
| Demographics | Rating | Rank | In Labor Force | Age 45-54 |
| Immigrants | Caribbean | 2.5 /100 | #226 | Tragic 82.1% |
| Immigrants | Germany | 2.4 /100 | #227 | Tragic 82.1% |
| Cape Verdeans | 2.1 /100 | #228 | Tragic 82.1% |
| Immigrants | Burma/Myanmar | 1.9 /100 | #229 | Tragic 82.0% |
| Jamaicans | 1.8 /100 | #230 | Tragic 82.0% |
| Immigrants | Senegal | 1.7 /100 | #231 | Tragic 82.0% |
| Immigrants | Portugal | 1.7 /100 | #232 | Tragic 82.0% |
| Malaysians | 1.7 /100 | #233 | Tragic 82.0% |
| Salvadorans | 1.7 /100 | #234 | Tragic 82.0% |
| Sub-Saharan Africans | 1.2 /100 | #235 | Tragic 82.0% |
| Basques | 1.2 /100 | #236 | Tragic 82.0% |
| Immigrants | Trinidad and Tobago | 1.2 /100 | #237 | Tragic 82.0% |
| Trinidadians and Tobagonians | 1.1 /100 | #238 | Tragic 81.9% |
| Immigrants | Thailand | 1.0 /100 | #239 | Tragic 81.9% |
| Immigrants | El Salvador | 1.0 /100 | #240 | Tragic 81.9% |
Demographics Similar to Immigrants from Sweden by In Labor Force | Age 45-54
In terms of in labor force | age 45-54, the demographic groups most similar to Immigrants from Sweden are Immigrants from Nigeria (83.0%, a difference of 0.010%), Immigrants from Netherlands (82.9%, a difference of 0.010%), Korean (82.9%, a difference of 0.010%), Romanian (83.0%, a difference of 0.020%), and Immigrants from France (83.0%, a difference of 0.020%).
| Demographics | Rating | Rank | In Labor Force | Age 45-54 |
| Immigrants | Scotland | 77.8 /100 | #142 | Good 83.0% |
| Okinawans | 77.0 /100 | #143 | Good 83.0% |
| Soviet Union | 76.8 /100 | #144 | Good 83.0% |
| Romanians | 75.4 /100 | #145 | Good 83.0% |
| Immigrants | France | 75.3 /100 | #146 | Good 83.0% |
| Czechoslovakians | 74.8 /100 | #147 | Good 83.0% |
| Immigrants | Nigeria | 74.1 /100 | #148 | Good 83.0% |
| Immigrants | Sweden | 73.3 /100 | #149 | Good 82.9% |
| Immigrants | Netherlands | 72.6 /100 | #150 | Good 82.9% |
| Koreans | 71.9 /100 | #151 | Good 82.9% |
| Slavs | 71.5 /100 | #152 | Good 82.9% |
| Immigrants | Indonesia | 70.6 /100 | #153 | Good 82.9% |
| Immigrants | Ghana | 70.3 /100 | #154 | Good 82.9% |
| Immigrants | Philippines | 69.0 /100 | #155 | Good 82.9% |
| Immigrants | Saudi Arabia | 68.8 /100 | #156 | Good 82.9% |