Marshallese vs Immigrants from Sweden In Labor Force | Age 45-54
COMPARE
Marshallese
Immigrants from Sweden
In Labor Force | Age 45-54
In Labor Force | Age 45-54 Comparison
Marshallese
Immigrants from Sweden
80.3%
IN LABOR FORCE | AGE 45-54
0.0/ 100
METRIC RATING
298th/ 347
METRIC RANK
82.9%
IN LABOR FORCE | AGE 45-54
73.3/ 100
METRIC RATING
149th/ 347
METRIC RANK
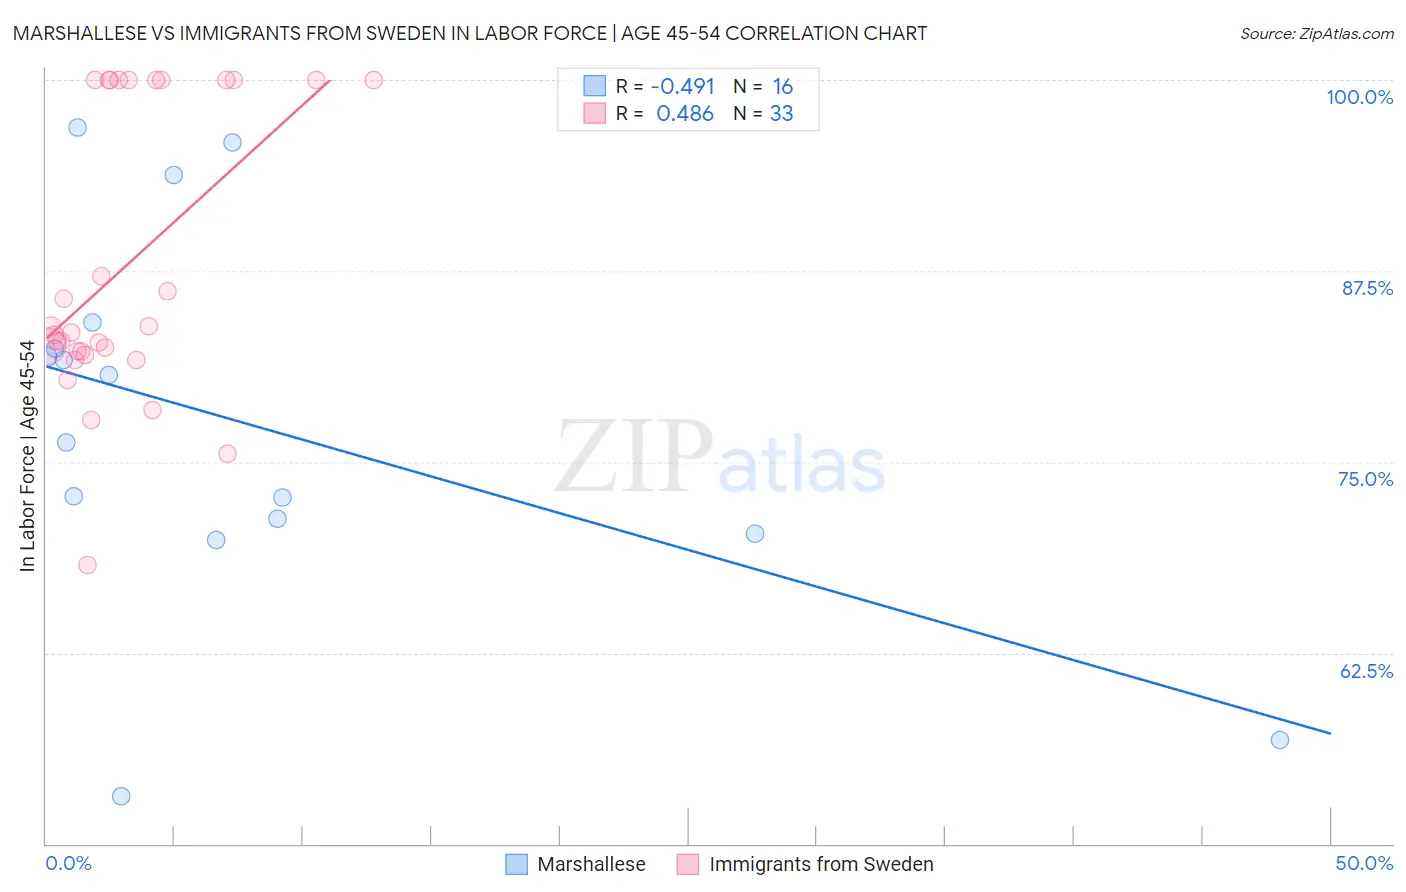
Marshallese vs Immigrants from Sweden In Labor Force | Age 45-54 Correlation Chart
The statistical analysis conducted on geographies consisting of 14,761,315 people shows a moderate negative correlation between the proportion of Marshallese and labor force participation rate among population between the ages 45 and 54 in the United States with a correlation coefficient (R) of -0.491 and weighted average of 80.3%. Similarly, the statistical analysis conducted on geographies consisting of 164,697,999 people shows a moderate positive correlation between the proportion of Immigrants from Sweden and labor force participation rate among population between the ages 45 and 54 in the United States with a correlation coefficient (R) of 0.486 and weighted average of 82.9%, a difference of 3.2%.
In Labor Force | Age 45-54 Correlation Summary
| Measurement | Marshallese | Immigrants from Sweden |
| Minimum | 53.1% | 68.3% |
| Maximum | 96.9% | 100.0% |
| Range | 43.8% | 31.7% |
| Mean | 77.5% | 87.8% |
| Median | 78.5% | 83.5% |
| Interquartile 25% (IQ1) | 70.8% | 82.1% |
| Interquartile 75% (IQ3) | 83.3% | 100.0% |
| Interquartile Range (IQR) | 12.5% | 17.9% |
| Standard Deviation (Sample) | 12.4% | 9.3% |
| Standard Deviation (Population) | 12.0% | 9.2% |
Similar Demographics by In Labor Force | Age 45-54
Demographics Similar to Marshallese by In Labor Force | Age 45-54
In terms of in labor force | age 45-54, the demographic groups most similar to Marshallese are American (80.4%, a difference of 0.040%), Dominican (80.3%, a difference of 0.11%), Fijian (80.2%, a difference of 0.11%), Spanish American Indian (80.2%, a difference of 0.13%), and Immigrants from Central America (80.2%, a difference of 0.20%).
| Demographics | Rating | Rank | In Labor Force | Age 45-54 |
| Immigrants | Belize | 0.0 /100 | #291 | Tragic 80.6% |
| Iroquois | 0.0 /100 | #292 | Tragic 80.6% |
| Osage | 0.0 /100 | #293 | Tragic 80.6% |
| Yakama | 0.0 /100 | #294 | Tragic 80.6% |
| Nepalese | 0.0 /100 | #295 | Tragic 80.5% |
| Africans | 0.0 /100 | #296 | Tragic 80.5% |
| Americans | 0.0 /100 | #297 | Tragic 80.4% |
| Marshallese | 0.0 /100 | #298 | Tragic 80.3% |
| Dominicans | 0.0 /100 | #299 | Tragic 80.3% |
| Fijians | 0.0 /100 | #300 | Tragic 80.2% |
| Spanish American Indians | 0.0 /100 | #301 | Tragic 80.2% |
| Immigrants | Central America | 0.0 /100 | #302 | Tragic 80.2% |
| Immigrants | Azores | 0.0 /100 | #303 | Tragic 80.1% |
| Hispanics or Latinos | 0.0 /100 | #304 | Tragic 80.1% |
| Immigrants | Dominican Republic | 0.0 /100 | #305 | Tragic 80.1% |
Demographics Similar to Immigrants from Sweden by In Labor Force | Age 45-54
In terms of in labor force | age 45-54, the demographic groups most similar to Immigrants from Sweden are Immigrants from Nigeria (83.0%, a difference of 0.010%), Immigrants from Netherlands (82.9%, a difference of 0.010%), Korean (82.9%, a difference of 0.010%), Romanian (83.0%, a difference of 0.020%), and Immigrants from France (83.0%, a difference of 0.020%).
| Demographics | Rating | Rank | In Labor Force | Age 45-54 |
| Immigrants | Scotland | 77.8 /100 | #142 | Good 83.0% |
| Okinawans | 77.0 /100 | #143 | Good 83.0% |
| Soviet Union | 76.8 /100 | #144 | Good 83.0% |
| Romanians | 75.4 /100 | #145 | Good 83.0% |
| Immigrants | France | 75.3 /100 | #146 | Good 83.0% |
| Czechoslovakians | 74.8 /100 | #147 | Good 83.0% |
| Immigrants | Nigeria | 74.1 /100 | #148 | Good 83.0% |
| Immigrants | Sweden | 73.3 /100 | #149 | Good 82.9% |
| Immigrants | Netherlands | 72.6 /100 | #150 | Good 82.9% |
| Koreans | 71.9 /100 | #151 | Good 82.9% |
| Slavs | 71.5 /100 | #152 | Good 82.9% |
| Immigrants | Indonesia | 70.6 /100 | #153 | Good 82.9% |
| Immigrants | Ghana | 70.3 /100 | #154 | Good 82.9% |
| Immigrants | Philippines | 69.0 /100 | #155 | Good 82.9% |
| Immigrants | Saudi Arabia | 68.8 /100 | #156 | Good 82.9% |