Delaware vs Albanian In Labor Force | Age 45-54
COMPARE
Delaware
Albanian
In Labor Force | Age 45-54
In Labor Force | Age 45-54 Comparison
Delaware
Albanians
80.8%
IN LABOR FORCE | AGE 45-54
0.0/ 100
METRIC RATING
285th/ 347
METRIC RANK
83.3%
IN LABOR FORCE | AGE 45-54
93.9/ 100
METRIC RATING
103rd/ 347
METRIC RANK
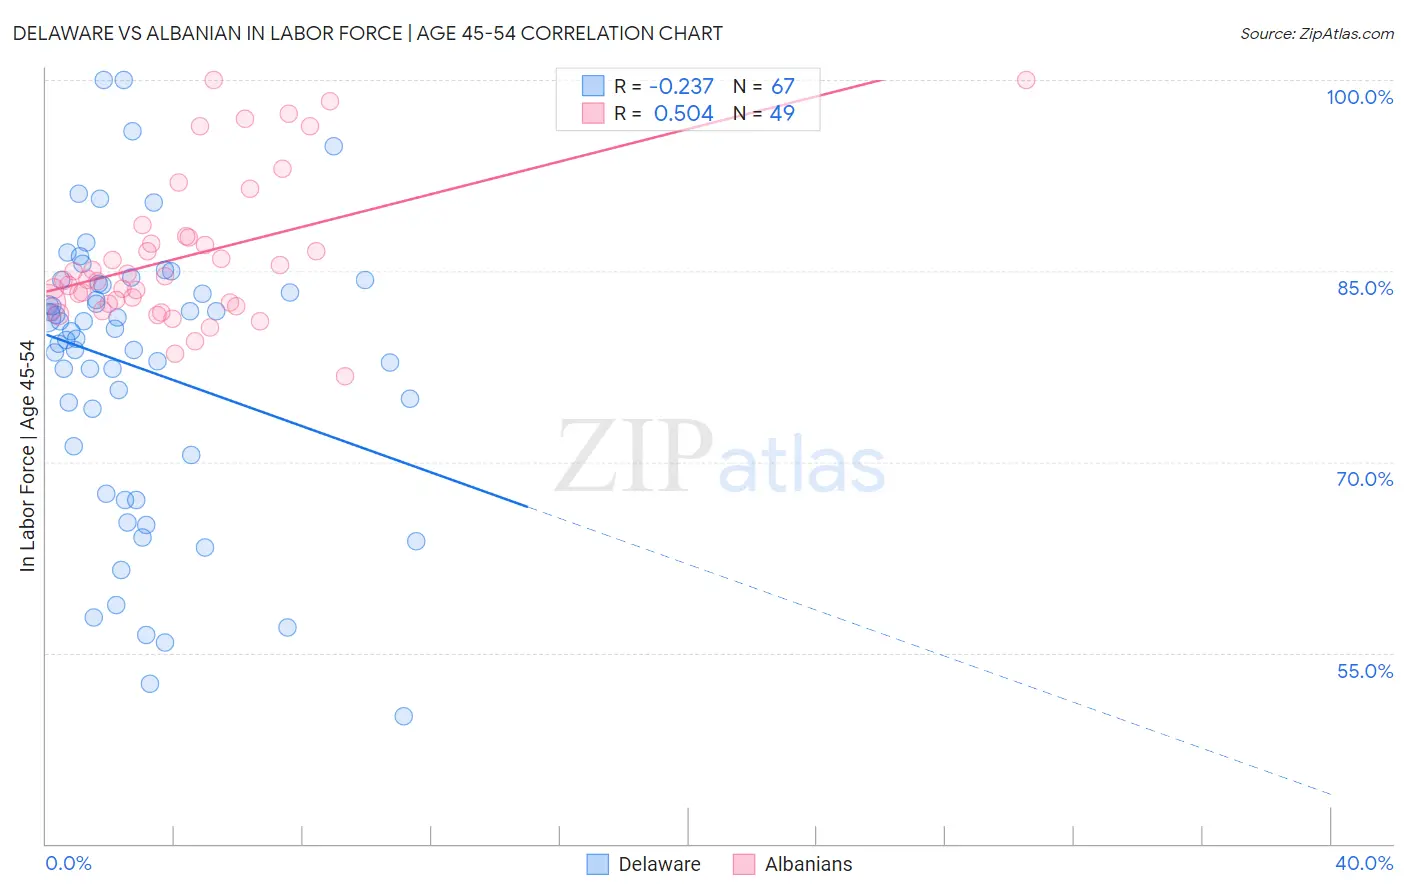
Delaware vs Albanian In Labor Force | Age 45-54 Correlation Chart
The statistical analysis conducted on geographies consisting of 96,219,228 people shows a weak negative correlation between the proportion of Delaware and labor force participation rate among population between the ages 45 and 54 in the United States with a correlation coefficient (R) of -0.237 and weighted average of 80.8%. Similarly, the statistical analysis conducted on geographies consisting of 193,191,598 people shows a substantial positive correlation between the proportion of Albanians and labor force participation rate among population between the ages 45 and 54 in the United States with a correlation coefficient (R) of 0.504 and weighted average of 83.3%, a difference of 3.1%.
In Labor Force | Age 45-54 Correlation Summary
| Measurement | Delaware | Albanian |
| Minimum | 50.0% | 76.7% |
| Maximum | 100.0% | 100.0% |
| Range | 50.0% | 23.3% |
| Mean | 77.4% | 86.2% |
| Median | 80.2% | 84.3% |
| Interquartile 25% (IQ1) | 70.5% | 82.5% |
| Interquartile 75% (IQ3) | 84.0% | 87.7% |
| Interquartile Range (IQR) | 13.5% | 5.2% |
| Standard Deviation (Sample) | 11.1% | 5.8% |
| Standard Deviation (Population) | 11.0% | 5.7% |
Similar Demographics by In Labor Force | Age 45-54
Demographics Similar to Delaware by In Labor Force | Age 45-54
In terms of in labor force | age 45-54, the demographic groups most similar to Delaware are Belizean (80.8%, a difference of 0.010%), Immigrants from Dominica (80.8%, a difference of 0.010%), Vietnamese (80.8%, a difference of 0.010%), Cree (80.8%, a difference of 0.010%), and Immigrants from Bangladesh (80.7%, a difference of 0.040%).
| Demographics | Rating | Rank | In Labor Force | Age 45-54 |
| Immigrants | Guatemala | 0.0 /100 | #278 | Tragic 81.1% |
| Immigrants | Micronesia | 0.0 /100 | #279 | Tragic 81.1% |
| Immigrants | Latin America | 0.0 /100 | #280 | Tragic 81.0% |
| Immigrants | Grenada | 0.0 /100 | #281 | Tragic 81.0% |
| Aleuts | 0.0 /100 | #282 | Tragic 81.0% |
| French American Indians | 0.0 /100 | #283 | Tragic 80.8% |
| Belizeans | 0.0 /100 | #284 | Tragic 80.8% |
| Delaware | 0.0 /100 | #285 | Tragic 80.8% |
| Immigrants | Dominica | 0.0 /100 | #286 | Tragic 80.8% |
| Vietnamese | 0.0 /100 | #287 | Tragic 80.8% |
| Cree | 0.0 /100 | #288 | Tragic 80.8% |
| Immigrants | Bangladesh | 0.0 /100 | #289 | Tragic 80.7% |
| Mexican American Indians | 0.0 /100 | #290 | Tragic 80.7% |
| Immigrants | Belize | 0.0 /100 | #291 | Tragic 80.6% |
| Iroquois | 0.0 /100 | #292 | Tragic 80.6% |
Demographics Similar to Albanians by In Labor Force | Age 45-54
In terms of in labor force | age 45-54, the demographic groups most similar to Albanians are Immigrants from Singapore (83.3%, a difference of 0.0%), Immigrants from Romania (83.3%, a difference of 0.0%), Immigrants from Middle Africa (83.3%, a difference of 0.010%), Mongolian (83.3%, a difference of 0.010%), and Immigrants from Belarus (83.3%, a difference of 0.010%).
| Demographics | Rating | Rank | In Labor Force | Age 45-54 |
| Immigrants | Kuwait | 94.8 /100 | #96 | Exceptional 83.3% |
| Palestinians | 94.8 /100 | #97 | Exceptional 83.3% |
| Maltese | 94.4 /100 | #98 | Exceptional 83.3% |
| Immigrants | Middle Africa | 94.3 /100 | #99 | Exceptional 83.3% |
| Mongolians | 94.2 /100 | #100 | Exceptional 83.3% |
| Immigrants | Belarus | 94.1 /100 | #101 | Exceptional 83.3% |
| Immigrants | Singapore | 93.9 /100 | #102 | Exceptional 83.3% |
| Albanians | 93.9 /100 | #103 | Exceptional 83.3% |
| Immigrants | Romania | 93.8 /100 | #104 | Exceptional 83.3% |
| Immigrants | South America | 93.5 /100 | #105 | Exceptional 83.2% |
| Sri Lankans | 93.2 /100 | #106 | Exceptional 83.2% |
| Iranians | 92.9 /100 | #107 | Exceptional 83.2% |
| Slovaks | 92.8 /100 | #108 | Exceptional 83.2% |
| Ukrainians | 92.7 /100 | #109 | Exceptional 83.2% |
| Immigrants | Africa | 92.6 /100 | #110 | Exceptional 83.2% |