Delaware vs Colombian In Labor Force | Age 45-54
COMPARE
Delaware
Colombian
In Labor Force | Age 45-54
In Labor Force | Age 45-54 Comparison
Delaware
Colombians
80.8%
IN LABOR FORCE | AGE 45-54
0.0/ 100
METRIC RATING
285th/ 347
METRIC RANK
83.4%
IN LABOR FORCE | AGE 45-54
97.3/ 100
METRIC RATING
71st/ 347
METRIC RANK
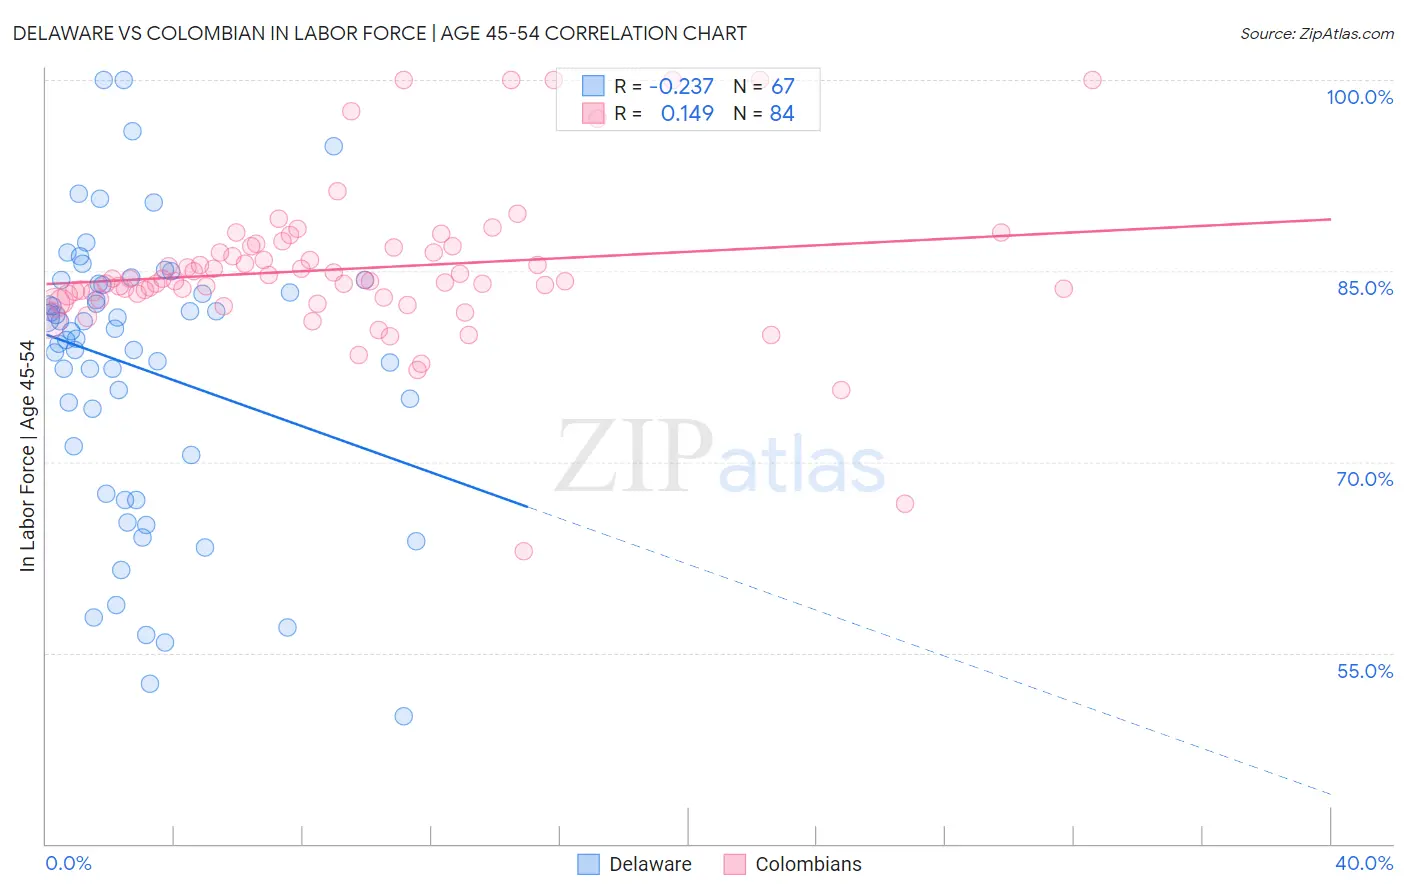
Delaware vs Colombian In Labor Force | Age 45-54 Correlation Chart
The statistical analysis conducted on geographies consisting of 96,219,228 people shows a weak negative correlation between the proportion of Delaware and labor force participation rate among population between the ages 45 and 54 in the United States with a correlation coefficient (R) of -0.237 and weighted average of 80.8%. Similarly, the statistical analysis conducted on geographies consisting of 419,305,643 people shows a poor positive correlation between the proportion of Colombians and labor force participation rate among population between the ages 45 and 54 in the United States with a correlation coefficient (R) of 0.149 and weighted average of 83.4%, a difference of 3.3%.
In Labor Force | Age 45-54 Correlation Summary
| Measurement | Delaware | Colombian |
| Minimum | 50.0% | 63.0% |
| Maximum | 100.0% | 100.0% |
| Range | 50.0% | 37.0% |
| Mean | 77.4% | 85.2% |
| Median | 80.2% | 84.3% |
| Interquartile 25% (IQ1) | 70.5% | 83.0% |
| Interquartile 75% (IQ3) | 84.0% | 86.9% |
| Interquartile Range (IQR) | 13.5% | 3.9% |
| Standard Deviation (Sample) | 11.1% | 6.1% |
| Standard Deviation (Population) | 11.0% | 6.1% |
Similar Demographics by In Labor Force | Age 45-54
Demographics Similar to Delaware by In Labor Force | Age 45-54
In terms of in labor force | age 45-54, the demographic groups most similar to Delaware are Belizean (80.8%, a difference of 0.010%), Immigrants from Dominica (80.8%, a difference of 0.010%), Vietnamese (80.8%, a difference of 0.010%), Cree (80.8%, a difference of 0.010%), and Immigrants from Bangladesh (80.7%, a difference of 0.040%).
| Demographics | Rating | Rank | In Labor Force | Age 45-54 |
| Immigrants | Guatemala | 0.0 /100 | #278 | Tragic 81.1% |
| Immigrants | Micronesia | 0.0 /100 | #279 | Tragic 81.1% |
| Immigrants | Latin America | 0.0 /100 | #280 | Tragic 81.0% |
| Immigrants | Grenada | 0.0 /100 | #281 | Tragic 81.0% |
| Aleuts | 0.0 /100 | #282 | Tragic 81.0% |
| French American Indians | 0.0 /100 | #283 | Tragic 80.8% |
| Belizeans | 0.0 /100 | #284 | Tragic 80.8% |
| Delaware | 0.0 /100 | #285 | Tragic 80.8% |
| Immigrants | Dominica | 0.0 /100 | #286 | Tragic 80.8% |
| Vietnamese | 0.0 /100 | #287 | Tragic 80.8% |
| Cree | 0.0 /100 | #288 | Tragic 80.8% |
| Immigrants | Bangladesh | 0.0 /100 | #289 | Tragic 80.7% |
| Mexican American Indians | 0.0 /100 | #290 | Tragic 80.7% |
| Immigrants | Belize | 0.0 /100 | #291 | Tragic 80.6% |
| Iroquois | 0.0 /100 | #292 | Tragic 80.6% |
Demographics Similar to Colombians by In Labor Force | Age 45-54
In terms of in labor force | age 45-54, the demographic groups most similar to Colombians are Immigrants from Latvia (83.4%, a difference of 0.0%), Taiwanese (83.4%, a difference of 0.010%), Immigrants from Colombia (83.4%, a difference of 0.020%), Serbian (83.4%, a difference of 0.020%), and Immigrants from Czechoslovakia (83.4%, a difference of 0.020%).
| Demographics | Rating | Rank | In Labor Force | Age 45-54 |
| Immigrants | Kenya | 97.9 /100 | #64 | Exceptional 83.5% |
| Egyptians | 97.9 /100 | #65 | Exceptional 83.5% |
| Asians | 97.7 /100 | #66 | Exceptional 83.4% |
| Chileans | 97.7 /100 | #67 | Exceptional 83.4% |
| Immigrants | Colombia | 97.6 /100 | #68 | Exceptional 83.4% |
| Taiwanese | 97.5 /100 | #69 | Exceptional 83.4% |
| Immigrants | Latvia | 97.4 /100 | #70 | Exceptional 83.4% |
| Colombians | 97.3 /100 | #71 | Exceptional 83.4% |
| Serbians | 97.2 /100 | #72 | Exceptional 83.4% |
| Immigrants | Czechoslovakia | 97.1 /100 | #73 | Exceptional 83.4% |
| Immigrants | Somalia | 96.9 /100 | #74 | Exceptional 83.4% |
| Estonians | 96.9 /100 | #75 | Exceptional 83.4% |
| Russians | 96.8 /100 | #76 | Exceptional 83.4% |
| Cubans | 96.7 /100 | #77 | Exceptional 83.4% |
| Immigrants | Egypt | 96.6 /100 | #78 | Exceptional 83.4% |