Delaware vs Tohono O'odham In Labor Force | Age 45-54
COMPARE
Delaware
Tohono O'odham
In Labor Force | Age 45-54
In Labor Force | Age 45-54 Comparison
Delaware
Tohono O'odham
80.8%
IN LABOR FORCE | AGE 45-54
0.0/ 100
METRIC RATING
285th/ 347
METRIC RANK
75.1%
IN LABOR FORCE | AGE 45-54
0.0/ 100
METRIC RATING
342nd/ 347
METRIC RANK
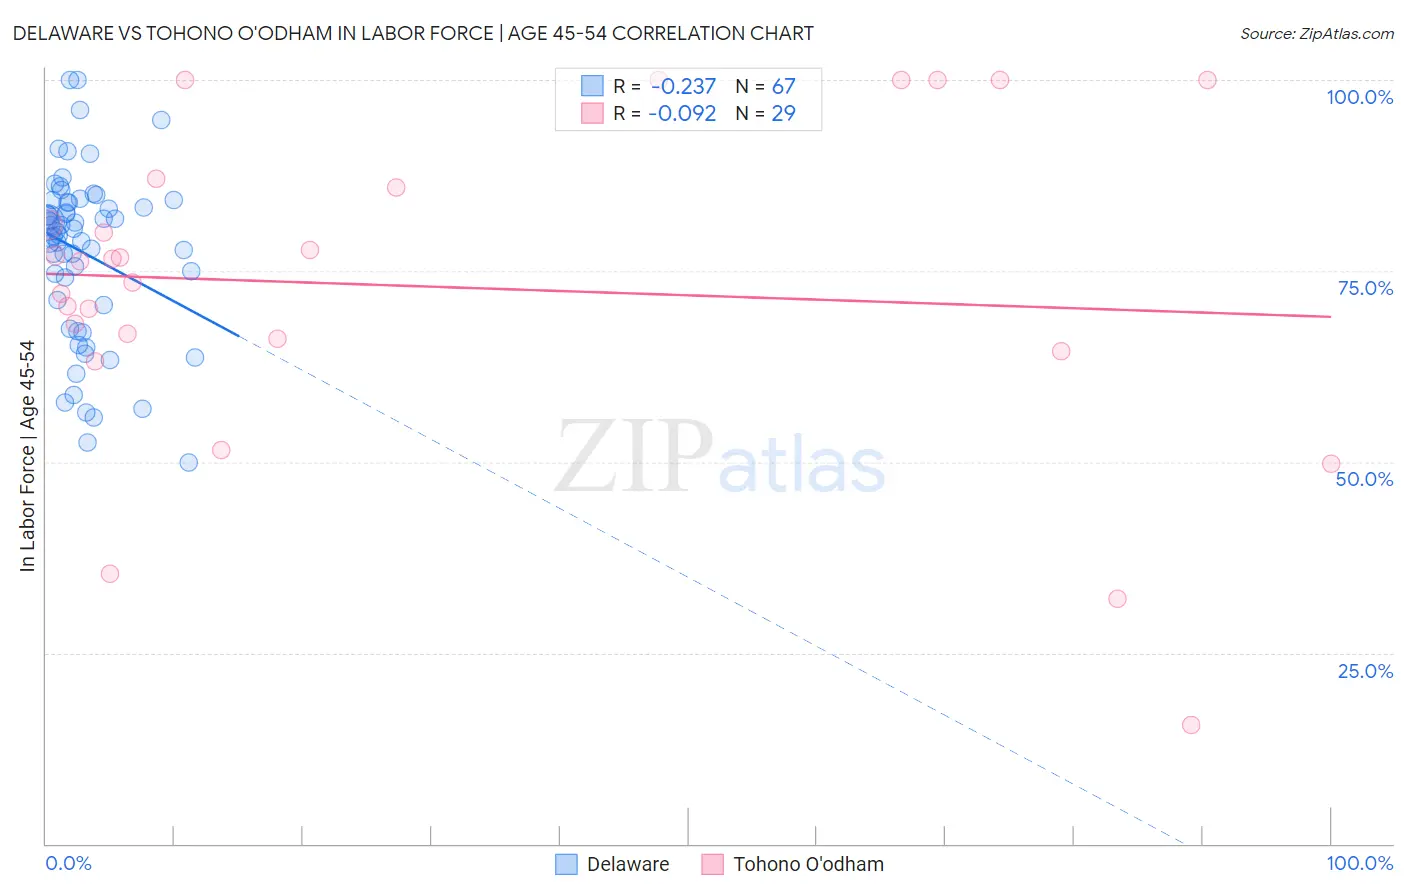
Delaware vs Tohono O'odham In Labor Force | Age 45-54 Correlation Chart
The statistical analysis conducted on geographies consisting of 96,219,228 people shows a weak negative correlation between the proportion of Delaware and labor force participation rate among population between the ages 45 and 54 in the United States with a correlation coefficient (R) of -0.237 and weighted average of 80.8%. Similarly, the statistical analysis conducted on geographies consisting of 58,717,652 people shows a slight negative correlation between the proportion of Tohono O'odham and labor force participation rate among population between the ages 45 and 54 in the United States with a correlation coefficient (R) of -0.092 and weighted average of 75.1%, a difference of 7.5%.
In Labor Force | Age 45-54 Correlation Summary
| Measurement | Delaware | Tohono O'odham |
| Minimum | 50.0% | 15.5% |
| Maximum | 100.0% | 100.0% |
| Range | 50.0% | 84.5% |
| Mean | 77.4% | 73.0% |
| Median | 80.2% | 76.2% |
| Interquartile 25% (IQ1) | 70.5% | 65.3% |
| Interquartile 75% (IQ3) | 84.0% | 86.5% |
| Interquartile Range (IQR) | 13.5% | 21.2% |
| Standard Deviation (Sample) | 11.1% | 21.2% |
| Standard Deviation (Population) | 11.0% | 20.9% |
Similar Demographics by In Labor Force | Age 45-54
Demographics Similar to Delaware by In Labor Force | Age 45-54
In terms of in labor force | age 45-54, the demographic groups most similar to Delaware are Belizean (80.8%, a difference of 0.010%), Immigrants from Dominica (80.8%, a difference of 0.010%), Vietnamese (80.8%, a difference of 0.010%), Cree (80.8%, a difference of 0.010%), and Immigrants from Bangladesh (80.7%, a difference of 0.040%).
| Demographics | Rating | Rank | In Labor Force | Age 45-54 |
| Immigrants | Guatemala | 0.0 /100 | #278 | Tragic 81.1% |
| Immigrants | Micronesia | 0.0 /100 | #279 | Tragic 81.1% |
| Immigrants | Latin America | 0.0 /100 | #280 | Tragic 81.0% |
| Immigrants | Grenada | 0.0 /100 | #281 | Tragic 81.0% |
| Aleuts | 0.0 /100 | #282 | Tragic 81.0% |
| French American Indians | 0.0 /100 | #283 | Tragic 80.8% |
| Belizeans | 0.0 /100 | #284 | Tragic 80.8% |
| Delaware | 0.0 /100 | #285 | Tragic 80.8% |
| Immigrants | Dominica | 0.0 /100 | #286 | Tragic 80.8% |
| Vietnamese | 0.0 /100 | #287 | Tragic 80.8% |
| Cree | 0.0 /100 | #288 | Tragic 80.8% |
| Immigrants | Bangladesh | 0.0 /100 | #289 | Tragic 80.7% |
| Mexican American Indians | 0.0 /100 | #290 | Tragic 80.7% |
| Immigrants | Belize | 0.0 /100 | #291 | Tragic 80.6% |
| Iroquois | 0.0 /100 | #292 | Tragic 80.6% |
Demographics Similar to Tohono O'odham by In Labor Force | Age 45-54
In terms of in labor force | age 45-54, the demographic groups most similar to Tohono O'odham are Hopi (75.0%, a difference of 0.18%), Pueblo (75.5%, a difference of 0.49%), Lumbee (75.6%, a difference of 0.61%), Immigrants from Yemen (74.4%, a difference of 0.96%), and Puerto Rican (75.9%, a difference of 1.1%).
| Demographics | Rating | Rank | In Labor Force | Age 45-54 |
| Natives/Alaskans | 0.0 /100 | #333 | Tragic 77.1% |
| Apache | 0.0 /100 | #334 | Tragic 77.1% |
| Arapaho | 0.0 /100 | #335 | Tragic 77.1% |
| Paiute | 0.0 /100 | #336 | Tragic 76.7% |
| Ute | 0.0 /100 | #337 | Tragic 76.6% |
| Yuman | 0.0 /100 | #338 | Tragic 76.3% |
| Puerto Ricans | 0.0 /100 | #339 | Tragic 75.9% |
| Lumbee | 0.0 /100 | #340 | Tragic 75.6% |
| Pueblo | 0.0 /100 | #341 | Tragic 75.5% |
| Tohono O'odham | 0.0 /100 | #342 | Tragic 75.1% |
| Hopi | 0.0 /100 | #343 | Tragic 75.0% |
| Immigrants | Yemen | 0.0 /100 | #344 | Tragic 74.4% |
| Houma | 0.0 /100 | #345 | Tragic 74.1% |
| Pima | 0.0 /100 | #346 | Tragic 72.8% |
| Navajo | 0.0 /100 | #347 | Tragic 72.8% |