Czechoslovakian vs Immigrants from Croatia In Labor Force | Age 35-44
COMPARE
Czechoslovakian
Immigrants from Croatia
In Labor Force | Age 35-44
In Labor Force | Age 35-44 Comparison
Czechoslovakians
Immigrants from Croatia
84.6%
IN LABOR FORCE | AGE 35-44
82.6/ 100
METRIC RATING
138th/ 347
METRIC RANK
85.1%
IN LABOR FORCE | AGE 35-44
99.5/ 100
METRIC RATING
56th/ 347
METRIC RANK
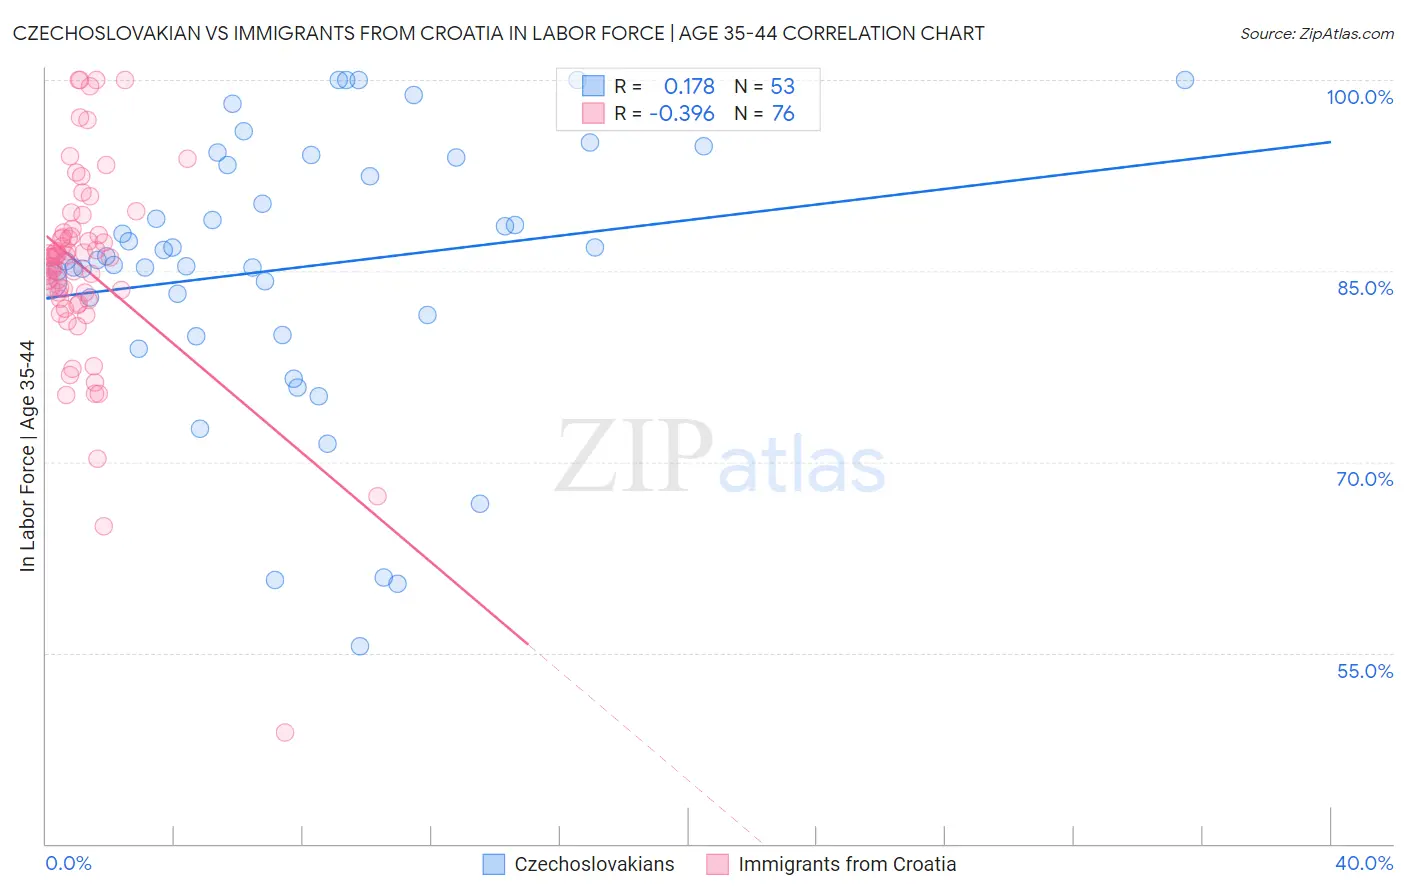
Czechoslovakian vs Immigrants from Croatia In Labor Force | Age 35-44 Correlation Chart
The statistical analysis conducted on geographies consisting of 368,545,873 people shows a poor positive correlation between the proportion of Czechoslovakians and labor force participation rate among population between the ages 35 and 44 in the United States with a correlation coefficient (R) of 0.178 and weighted average of 84.6%. Similarly, the statistical analysis conducted on geographies consisting of 132,569,777 people shows a mild negative correlation between the proportion of Immigrants from Croatia and labor force participation rate among population between the ages 35 and 44 in the United States with a correlation coefficient (R) of -0.396 and weighted average of 85.1%, a difference of 0.60%.
In Labor Force | Age 35-44 Correlation Summary
| Measurement | Czechoslovakian | Immigrants from Croatia |
| Minimum | 55.5% | 48.7% |
| Maximum | 100.0% | 100.0% |
| Range | 44.5% | 51.3% |
| Mean | 85.2% | 85.3% |
| Median | 85.8% | 86.1% |
| Interquartile 25% (IQ1) | 80.8% | 82.8% |
| Interquartile 75% (IQ3) | 93.6% | 87.9% |
| Interquartile Range (IQR) | 12.8% | 5.2% |
| Standard Deviation (Sample) | 10.7% | 8.1% |
| Standard Deviation (Population) | 10.6% | 8.0% |
Similar Demographics by In Labor Force | Age 35-44
Demographics Similar to Czechoslovakians by In Labor Force | Age 35-44
In terms of in labor force | age 35-44, the demographic groups most similar to Czechoslovakians are Immigrants from Zaire (84.6%, a difference of 0.0%), Immigrants from Japan (84.6%, a difference of 0.010%), Immigrants from Chile (84.6%, a difference of 0.020%), Immigrants from Belgium (84.6%, a difference of 0.020%), and Immigrants from Uruguay (84.6%, a difference of 0.030%).
| Demographics | Rating | Rank | In Labor Force | Age 35-44 |
| Immigrants | Scotland | 89.6 /100 | #131 | Excellent 84.7% |
| Austrians | 89.4 /100 | #132 | Excellent 84.7% |
| Argentineans | 88.4 /100 | #133 | Excellent 84.6% |
| Immigrants | Korea | 88.2 /100 | #134 | Excellent 84.6% |
| Immigrants | Malaysia | 87.5 /100 | #135 | Excellent 84.6% |
| Afghans | 86.3 /100 | #136 | Excellent 84.6% |
| Immigrants | Chile | 84.6 /100 | #137 | Excellent 84.6% |
| Czechoslovakians | 82.6 /100 | #138 | Excellent 84.6% |
| Immigrants | Zaire | 82.5 /100 | #139 | Excellent 84.6% |
| Immigrants | Japan | 81.4 /100 | #140 | Excellent 84.6% |
| Immigrants | Belgium | 80.8 /100 | #141 | Excellent 84.6% |
| Immigrants | Uruguay | 80.1 /100 | #142 | Excellent 84.6% |
| Immigrants | Ukraine | 79.7 /100 | #143 | Good 84.6% |
| Immigrants | Jamaica | 79.4 /100 | #144 | Good 84.6% |
| Immigrants | Saudi Arabia | 79.4 /100 | #145 | Good 84.6% |
Demographics Similar to Immigrants from Croatia by In Labor Force | Age 35-44
In terms of in labor force | age 35-44, the demographic groups most similar to Immigrants from Croatia are Turkish (85.1%, a difference of 0.010%), Soviet Union (85.1%, a difference of 0.010%), Chinese (85.1%, a difference of 0.020%), Slovak (85.1%, a difference of 0.020%), and Serbian (85.1%, a difference of 0.020%).
| Demographics | Rating | Rank | In Labor Force | Age 35-44 |
| Croatians | 99.7 /100 | #49 | Exceptional 85.2% |
| Thais | 99.7 /100 | #50 | Exceptional 85.2% |
| Immigrants | Albania | 99.7 /100 | #51 | Exceptional 85.1% |
| Immigrants | Kenya | 99.6 /100 | #52 | Exceptional 85.1% |
| Taiwanese | 99.6 /100 | #53 | Exceptional 85.1% |
| Turks | 99.5 /100 | #54 | Exceptional 85.1% |
| Soviet Union | 99.5 /100 | #55 | Exceptional 85.1% |
| Immigrants | Croatia | 99.5 /100 | #56 | Exceptional 85.1% |
| Chinese | 99.4 /100 | #57 | Exceptional 85.1% |
| Slovaks | 99.4 /100 | #58 | Exceptional 85.1% |
| Serbians | 99.4 /100 | #59 | Exceptional 85.1% |
| Albanians | 99.4 /100 | #60 | Exceptional 85.1% |
| Immigrants | Latvia | 99.3 /100 | #61 | Exceptional 85.0% |
| Immigrants | Moldova | 99.3 /100 | #62 | Exceptional 85.0% |
| Immigrants | Uganda | 99.3 /100 | #63 | Exceptional 85.0% |