Guatemalan vs Immigrants from Croatia In Labor Force | Age 35-44
COMPARE
Guatemalan
Immigrants from Croatia
In Labor Force | Age 35-44
In Labor Force | Age 35-44 Comparison
Guatemalans
Immigrants from Croatia
83.0%
IN LABOR FORCE | AGE 35-44
0.0/ 100
METRIC RATING
281st/ 347
METRIC RANK
85.1%
IN LABOR FORCE | AGE 35-44
99.5/ 100
METRIC RATING
56th/ 347
METRIC RANK
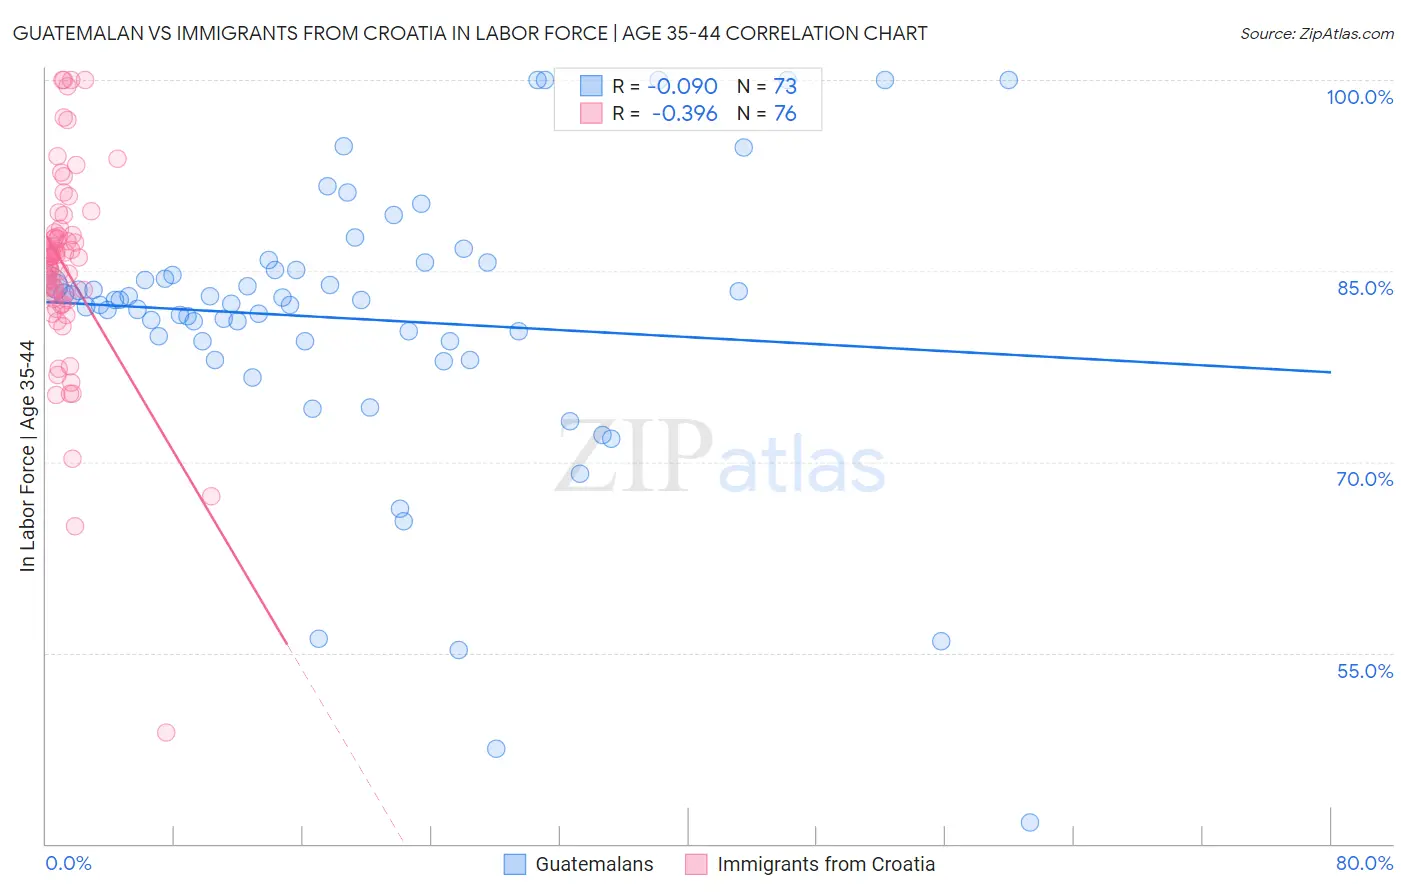
Guatemalan vs Immigrants from Croatia In Labor Force | Age 35-44 Correlation Chart
The statistical analysis conducted on geographies consisting of 409,363,843 people shows a slight negative correlation between the proportion of Guatemalans and labor force participation rate among population between the ages 35 and 44 in the United States with a correlation coefficient (R) of -0.090 and weighted average of 83.0%. Similarly, the statistical analysis conducted on geographies consisting of 132,569,777 people shows a mild negative correlation between the proportion of Immigrants from Croatia and labor force participation rate among population between the ages 35 and 44 in the United States with a correlation coefficient (R) of -0.396 and weighted average of 85.1%, a difference of 2.5%.
In Labor Force | Age 35-44 Correlation Summary
| Measurement | Guatemalan | Immigrants from Croatia |
| Minimum | 41.7% | 48.7% |
| Maximum | 100.0% | 100.0% |
| Range | 58.3% | 51.3% |
| Mean | 81.2% | 85.3% |
| Median | 82.7% | 86.1% |
| Interquartile 25% (IQ1) | 79.5% | 82.8% |
| Interquartile 75% (IQ3) | 85.1% | 87.9% |
| Interquartile Range (IQR) | 5.6% | 5.2% |
| Standard Deviation (Sample) | 11.0% | 8.1% |
| Standard Deviation (Population) | 11.0% | 8.0% |
Similar Demographics by In Labor Force | Age 35-44
Demographics Similar to Guatemalans by In Labor Force | Age 35-44
In terms of in labor force | age 35-44, the demographic groups most similar to Guatemalans are Osage (82.9%, a difference of 0.040%), Immigrants from Guatemala (82.9%, a difference of 0.040%), Immigrants from Dominican Republic (82.9%, a difference of 0.050%), Fijian (82.9%, a difference of 0.060%), and Immigrants from Bangladesh (82.9%, a difference of 0.060%).
| Demographics | Rating | Rank | In Labor Force | Age 35-44 |
| Immigrants | Nonimmigrants | 0.0 /100 | #274 | Tragic 83.2% |
| Hawaiians | 0.0 /100 | #275 | Tragic 83.2% |
| Delaware | 0.0 /100 | #276 | Tragic 83.2% |
| Samoans | 0.0 /100 | #277 | Tragic 83.2% |
| Belizeans | 0.0 /100 | #278 | Tragic 83.1% |
| Immigrants | Micronesia | 0.0 /100 | #279 | Tragic 83.1% |
| Dominicans | 0.0 /100 | #280 | Tragic 83.1% |
| Guatemalans | 0.0 /100 | #281 | Tragic 83.0% |
| Osage | 0.0 /100 | #282 | Tragic 82.9% |
| Immigrants | Guatemala | 0.0 /100 | #283 | Tragic 82.9% |
| Immigrants | Dominican Republic | 0.0 /100 | #284 | Tragic 82.9% |
| Fijians | 0.0 /100 | #285 | Tragic 82.9% |
| Immigrants | Bangladesh | 0.0 /100 | #286 | Tragic 82.9% |
| Immigrants | Belize | 0.0 /100 | #287 | Tragic 82.9% |
| Puget Sound Salish | 0.0 /100 | #288 | Tragic 82.9% |
Demographics Similar to Immigrants from Croatia by In Labor Force | Age 35-44
In terms of in labor force | age 35-44, the demographic groups most similar to Immigrants from Croatia are Turkish (85.1%, a difference of 0.010%), Soviet Union (85.1%, a difference of 0.010%), Chinese (85.1%, a difference of 0.020%), Slovak (85.1%, a difference of 0.020%), and Serbian (85.1%, a difference of 0.020%).
| Demographics | Rating | Rank | In Labor Force | Age 35-44 |
| Croatians | 99.7 /100 | #49 | Exceptional 85.2% |
| Thais | 99.7 /100 | #50 | Exceptional 85.2% |
| Immigrants | Albania | 99.7 /100 | #51 | Exceptional 85.1% |
| Immigrants | Kenya | 99.6 /100 | #52 | Exceptional 85.1% |
| Taiwanese | 99.6 /100 | #53 | Exceptional 85.1% |
| Turks | 99.5 /100 | #54 | Exceptional 85.1% |
| Soviet Union | 99.5 /100 | #55 | Exceptional 85.1% |
| Immigrants | Croatia | 99.5 /100 | #56 | Exceptional 85.1% |
| Chinese | 99.4 /100 | #57 | Exceptional 85.1% |
| Slovaks | 99.4 /100 | #58 | Exceptional 85.1% |
| Serbians | 99.4 /100 | #59 | Exceptional 85.1% |
| Albanians | 99.4 /100 | #60 | Exceptional 85.1% |
| Immigrants | Latvia | 99.3 /100 | #61 | Exceptional 85.0% |
| Immigrants | Moldova | 99.3 /100 | #62 | Exceptional 85.0% |
| Immigrants | Uganda | 99.3 /100 | #63 | Exceptional 85.0% |