Immigrants from Sweden vs Immigrants from Croatia In Labor Force | Age 35-44
COMPARE
Immigrants from Sweden
Immigrants from Croatia
In Labor Force | Age 35-44
In Labor Force | Age 35-44 Comparison
Immigrants from Sweden
Immigrants from Croatia
84.8%
IN LABOR FORCE | AGE 35-44
95.2/ 100
METRIC RATING
104th/ 347
METRIC RANK
85.1%
IN LABOR FORCE | AGE 35-44
99.5/ 100
METRIC RATING
56th/ 347
METRIC RANK
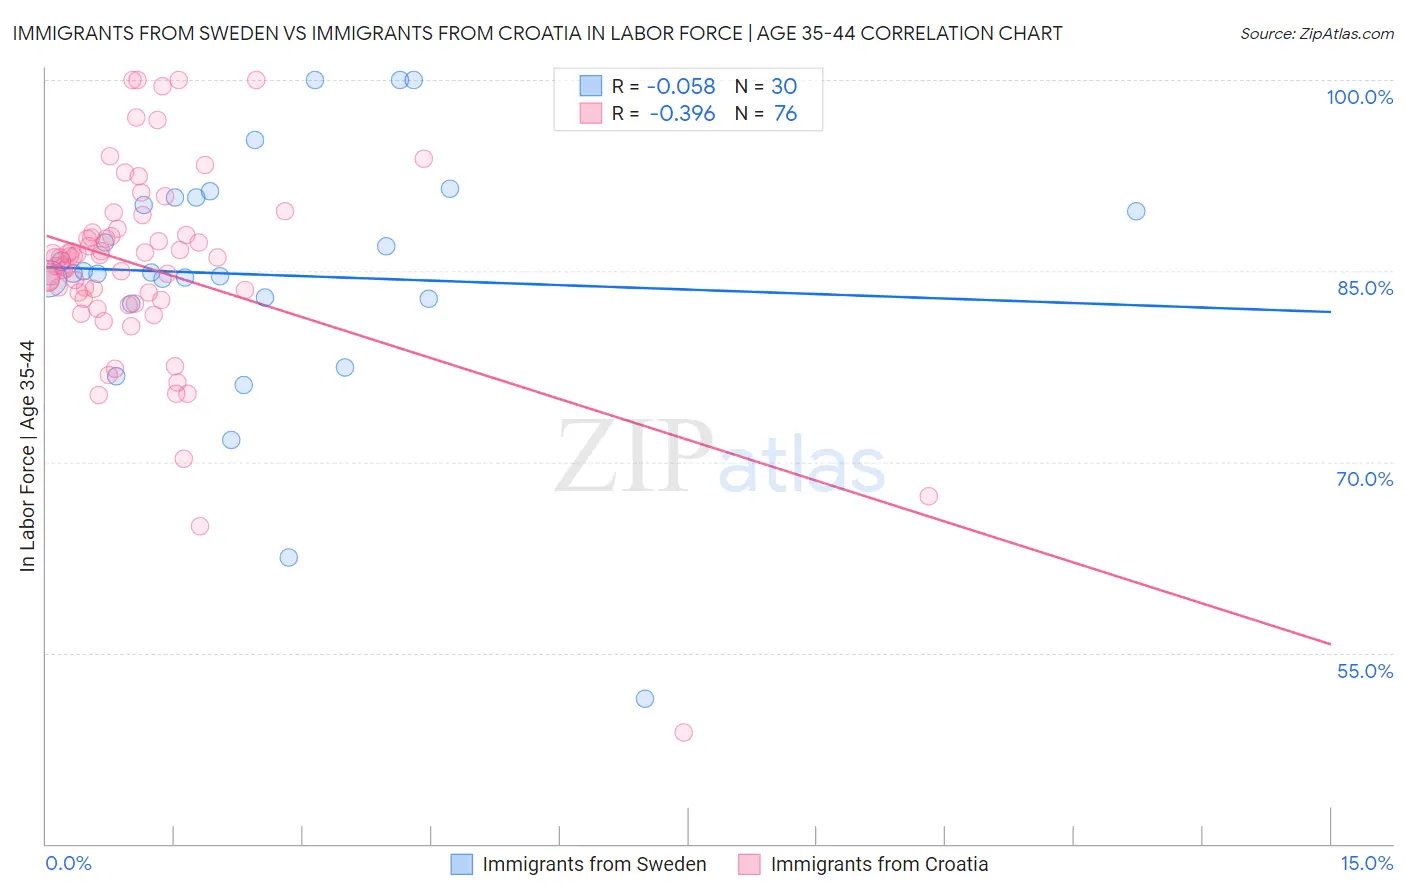
Immigrants from Sweden vs Immigrants from Croatia In Labor Force | Age 35-44 Correlation Chart
The statistical analysis conducted on geographies consisting of 164,707,751 people shows a slight negative correlation between the proportion of Immigrants from Sweden and labor force participation rate among population between the ages 35 and 44 in the United States with a correlation coefficient (R) of -0.058 and weighted average of 84.8%. Similarly, the statistical analysis conducted on geographies consisting of 132,569,777 people shows a mild negative correlation between the proportion of Immigrants from Croatia and labor force participation rate among population between the ages 35 and 44 in the United States with a correlation coefficient (R) of -0.396 and weighted average of 85.1%, a difference of 0.37%.
In Labor Force | Age 35-44 Correlation Summary
| Measurement | Immigrants from Sweden | Immigrants from Croatia |
| Minimum | 51.4% | 48.7% |
| Maximum | 100.0% | 100.0% |
| Range | 48.6% | 51.3% |
| Mean | 84.7% | 85.3% |
| Median | 84.8% | 86.1% |
| Interquartile 25% (IQ1) | 82.8% | 82.8% |
| Interquartile 75% (IQ3) | 90.8% | 87.9% |
| Interquartile Range (IQR) | 7.9% | 5.2% |
| Standard Deviation (Sample) | 10.2% | 8.1% |
| Standard Deviation (Population) | 10.0% | 8.0% |
Similar Demographics by In Labor Force | Age 35-44
Demographics Similar to Immigrants from Sweden by In Labor Force | Age 35-44
In terms of in labor force | age 35-44, the demographic groups most similar to Immigrants from Sweden are Immigrants from Southern Europe (84.8%, a difference of 0.0%), Immigrants from Belarus (84.8%, a difference of 0.0%), Immigrants from Australia (84.8%, a difference of 0.010%), South American (84.8%, a difference of 0.010%), and Immigrants from Bahamas (84.8%, a difference of 0.010%).
| Demographics | Rating | Rank | In Labor Force | Age 35-44 |
| Egyptians | 96.6 /100 | #97 | Exceptional 84.8% |
| Indians (Asian) | 96.1 /100 | #98 | Exceptional 84.8% |
| Haitians | 96.0 /100 | #99 | Exceptional 84.8% |
| Immigrants | Czechoslovakia | 95.9 /100 | #100 | Exceptional 84.8% |
| Immigrants | Australia | 95.5 /100 | #101 | Exceptional 84.8% |
| Immigrants | Southern Europe | 95.3 /100 | #102 | Exceptional 84.8% |
| Immigrants | Belarus | 95.3 /100 | #103 | Exceptional 84.8% |
| Immigrants | Sweden | 95.2 /100 | #104 | Exceptional 84.8% |
| South Americans | 95.0 /100 | #105 | Exceptional 84.8% |
| Immigrants | Bahamas | 94.8 /100 | #106 | Exceptional 84.8% |
| Immigrants | Romania | 94.7 /100 | #107 | Exceptional 84.8% |
| Immigrants | Argentina | 94.5 /100 | #108 | Exceptional 84.8% |
| Immigrants | Russia | 94.5 /100 | #109 | Exceptional 84.8% |
| Filipinos | 93.8 /100 | #110 | Exceptional 84.7% |
| Ukrainians | 93.5 /100 | #111 | Exceptional 84.7% |
Demographics Similar to Immigrants from Croatia by In Labor Force | Age 35-44
In terms of in labor force | age 35-44, the demographic groups most similar to Immigrants from Croatia are Turkish (85.1%, a difference of 0.010%), Soviet Union (85.1%, a difference of 0.010%), Chinese (85.1%, a difference of 0.020%), Slovak (85.1%, a difference of 0.020%), and Serbian (85.1%, a difference of 0.020%).
| Demographics | Rating | Rank | In Labor Force | Age 35-44 |
| Croatians | 99.7 /100 | #49 | Exceptional 85.2% |
| Thais | 99.7 /100 | #50 | Exceptional 85.2% |
| Immigrants | Albania | 99.7 /100 | #51 | Exceptional 85.1% |
| Immigrants | Kenya | 99.6 /100 | #52 | Exceptional 85.1% |
| Taiwanese | 99.6 /100 | #53 | Exceptional 85.1% |
| Turks | 99.5 /100 | #54 | Exceptional 85.1% |
| Soviet Union | 99.5 /100 | #55 | Exceptional 85.1% |
| Immigrants | Croatia | 99.5 /100 | #56 | Exceptional 85.1% |
| Chinese | 99.4 /100 | #57 | Exceptional 85.1% |
| Slovaks | 99.4 /100 | #58 | Exceptional 85.1% |
| Serbians | 99.4 /100 | #59 | Exceptional 85.1% |
| Albanians | 99.4 /100 | #60 | Exceptional 85.1% |
| Immigrants | Latvia | 99.3 /100 | #61 | Exceptional 85.0% |
| Immigrants | Moldova | 99.3 /100 | #62 | Exceptional 85.0% |
| Immigrants | Uganda | 99.3 /100 | #63 | Exceptional 85.0% |