Spanish American Indian vs Immigrants from Croatia In Labor Force | Age 35-44
COMPARE
Spanish American Indian
Immigrants from Croatia
In Labor Force | Age 35-44
In Labor Force | Age 35-44 Comparison
Spanish American Indians
Immigrants from Croatia
82.5%
IN LABOR FORCE | AGE 35-44
0.0/ 100
METRIC RATING
301st/ 347
METRIC RANK
85.1%
IN LABOR FORCE | AGE 35-44
99.5/ 100
METRIC RATING
56th/ 347
METRIC RANK
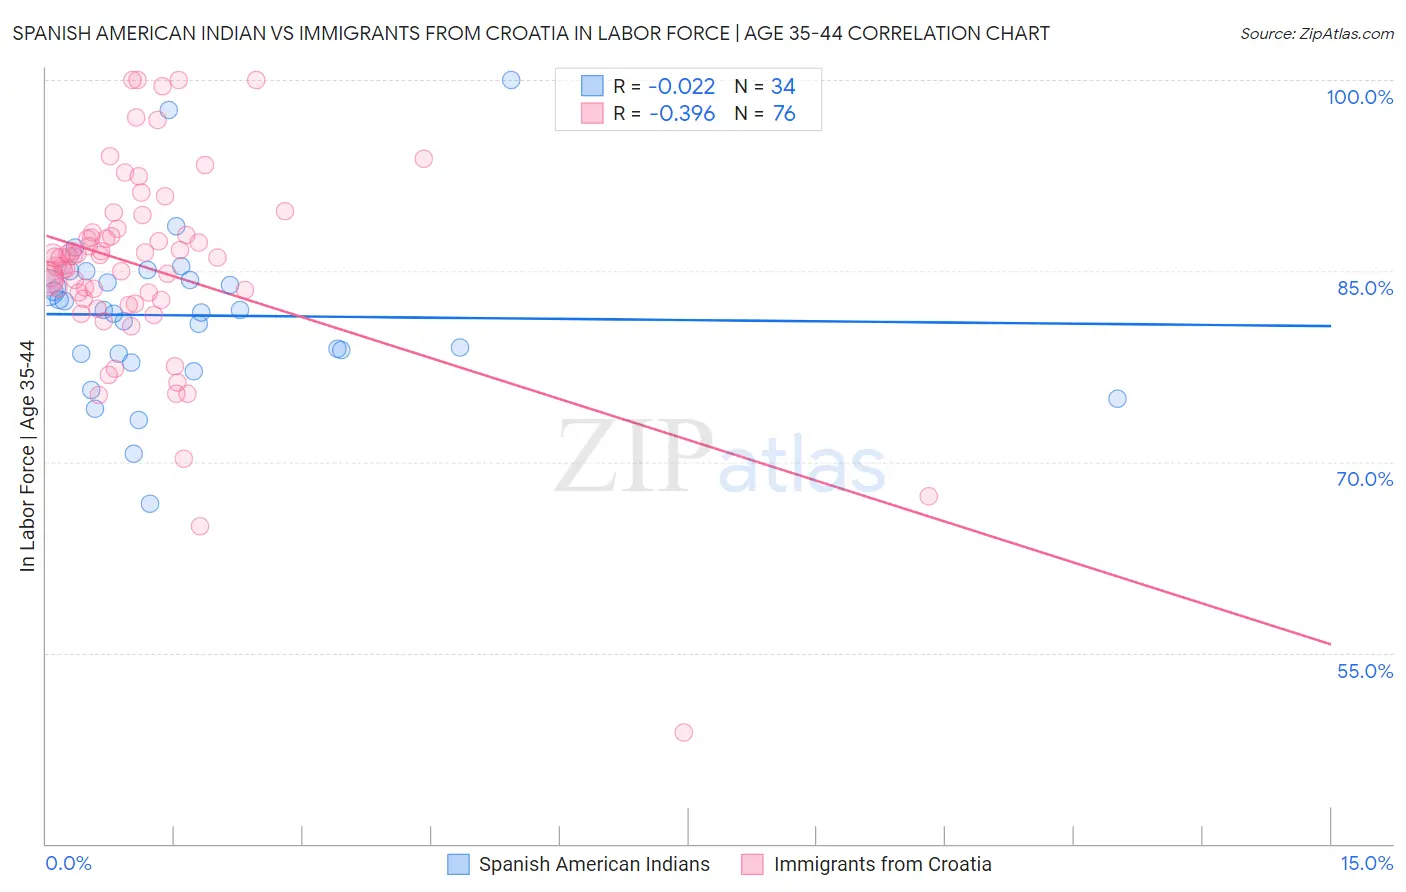
Spanish American Indian vs Immigrants from Croatia In Labor Force | Age 35-44 Correlation Chart
The statistical analysis conducted on geographies consisting of 73,144,470 people shows no correlation between the proportion of Spanish American Indians and labor force participation rate among population between the ages 35 and 44 in the United States with a correlation coefficient (R) of -0.022 and weighted average of 82.5%. Similarly, the statistical analysis conducted on geographies consisting of 132,569,777 people shows a mild negative correlation between the proportion of Immigrants from Croatia and labor force participation rate among population between the ages 35 and 44 in the United States with a correlation coefficient (R) of -0.396 and weighted average of 85.1%, a difference of 3.2%.
In Labor Force | Age 35-44 Correlation Summary
| Measurement | Spanish American Indian | Immigrants from Croatia |
| Minimum | 66.7% | 48.7% |
| Maximum | 100.0% | 100.0% |
| Range | 33.3% | 51.3% |
| Mean | 81.5% | 85.3% |
| Median | 81.8% | 86.1% |
| Interquartile 25% (IQ1) | 78.5% | 82.8% |
| Interquartile 75% (IQ3) | 84.3% | 87.9% |
| Interquartile Range (IQR) | 5.8% | 5.2% |
| Standard Deviation (Sample) | 6.4% | 8.1% |
| Standard Deviation (Population) | 6.3% | 8.0% |
Similar Demographics by In Labor Force | Age 35-44
Demographics Similar to Spanish American Indians by In Labor Force | Age 35-44
In terms of in labor force | age 35-44, the demographic groups most similar to Spanish American Indians are Central American Indian (82.5%, a difference of 0.020%), American (82.4%, a difference of 0.080%), Nepalese (82.4%, a difference of 0.080%), Marshallese (82.4%, a difference of 0.080%), and Tlingit-Haida (82.5%, a difference of 0.090%).
| Demographics | Rating | Rank | In Labor Force | Age 35-44 |
| Potawatomi | 0.0 /100 | #294 | Tragic 82.7% |
| Immigrants | Lebanon | 0.0 /100 | #295 | Tragic 82.7% |
| Mexican American Indians | 0.0 /100 | #296 | Tragic 82.6% |
| Hmong | 0.0 /100 | #297 | Tragic 82.6% |
| Ottawa | 0.0 /100 | #298 | Tragic 82.6% |
| Tlingit-Haida | 0.0 /100 | #299 | Tragic 82.5% |
| Central American Indians | 0.0 /100 | #300 | Tragic 82.5% |
| Spanish American Indians | 0.0 /100 | #301 | Tragic 82.5% |
| Americans | 0.0 /100 | #302 | Tragic 82.4% |
| Nepalese | 0.0 /100 | #303 | Tragic 82.4% |
| Marshallese | 0.0 /100 | #304 | Tragic 82.4% |
| Shoshone | 0.0 /100 | #305 | Tragic 82.2% |
| Blacks/African Americans | 0.0 /100 | #306 | Tragic 82.2% |
| Hispanics or Latinos | 0.0 /100 | #307 | Tragic 82.1% |
| Immigrants | Central America | 0.0 /100 | #308 | Tragic 82.0% |
Demographics Similar to Immigrants from Croatia by In Labor Force | Age 35-44
In terms of in labor force | age 35-44, the demographic groups most similar to Immigrants from Croatia are Turkish (85.1%, a difference of 0.010%), Soviet Union (85.1%, a difference of 0.010%), Chinese (85.1%, a difference of 0.020%), Slovak (85.1%, a difference of 0.020%), and Serbian (85.1%, a difference of 0.020%).
| Demographics | Rating | Rank | In Labor Force | Age 35-44 |
| Croatians | 99.7 /100 | #49 | Exceptional 85.2% |
| Thais | 99.7 /100 | #50 | Exceptional 85.2% |
| Immigrants | Albania | 99.7 /100 | #51 | Exceptional 85.1% |
| Immigrants | Kenya | 99.6 /100 | #52 | Exceptional 85.1% |
| Taiwanese | 99.6 /100 | #53 | Exceptional 85.1% |
| Turks | 99.5 /100 | #54 | Exceptional 85.1% |
| Soviet Union | 99.5 /100 | #55 | Exceptional 85.1% |
| Immigrants | Croatia | 99.5 /100 | #56 | Exceptional 85.1% |
| Chinese | 99.4 /100 | #57 | Exceptional 85.1% |
| Slovaks | 99.4 /100 | #58 | Exceptional 85.1% |
| Serbians | 99.4 /100 | #59 | Exceptional 85.1% |
| Albanians | 99.4 /100 | #60 | Exceptional 85.1% |
| Immigrants | Latvia | 99.3 /100 | #61 | Exceptional 85.0% |
| Immigrants | Moldova | 99.3 /100 | #62 | Exceptional 85.0% |
| Immigrants | Uganda | 99.3 /100 | #63 | Exceptional 85.0% |