Czechoslovakian vs Immigrants from Croatia In Labor Force | Age 30-34
COMPARE
Czechoslovakian
Immigrants from Croatia
In Labor Force | Age 30-34
In Labor Force | Age 30-34 Comparison
Czechoslovakians
Immigrants from Croatia
84.8%
IN LABOR FORCE | AGE 30-34
63.0/ 100
METRIC RATING
159th/ 347
METRIC RANK
86.1%
IN LABOR FORCE | AGE 30-34
100.0/ 100
METRIC RATING
13th/ 347
METRIC RANK
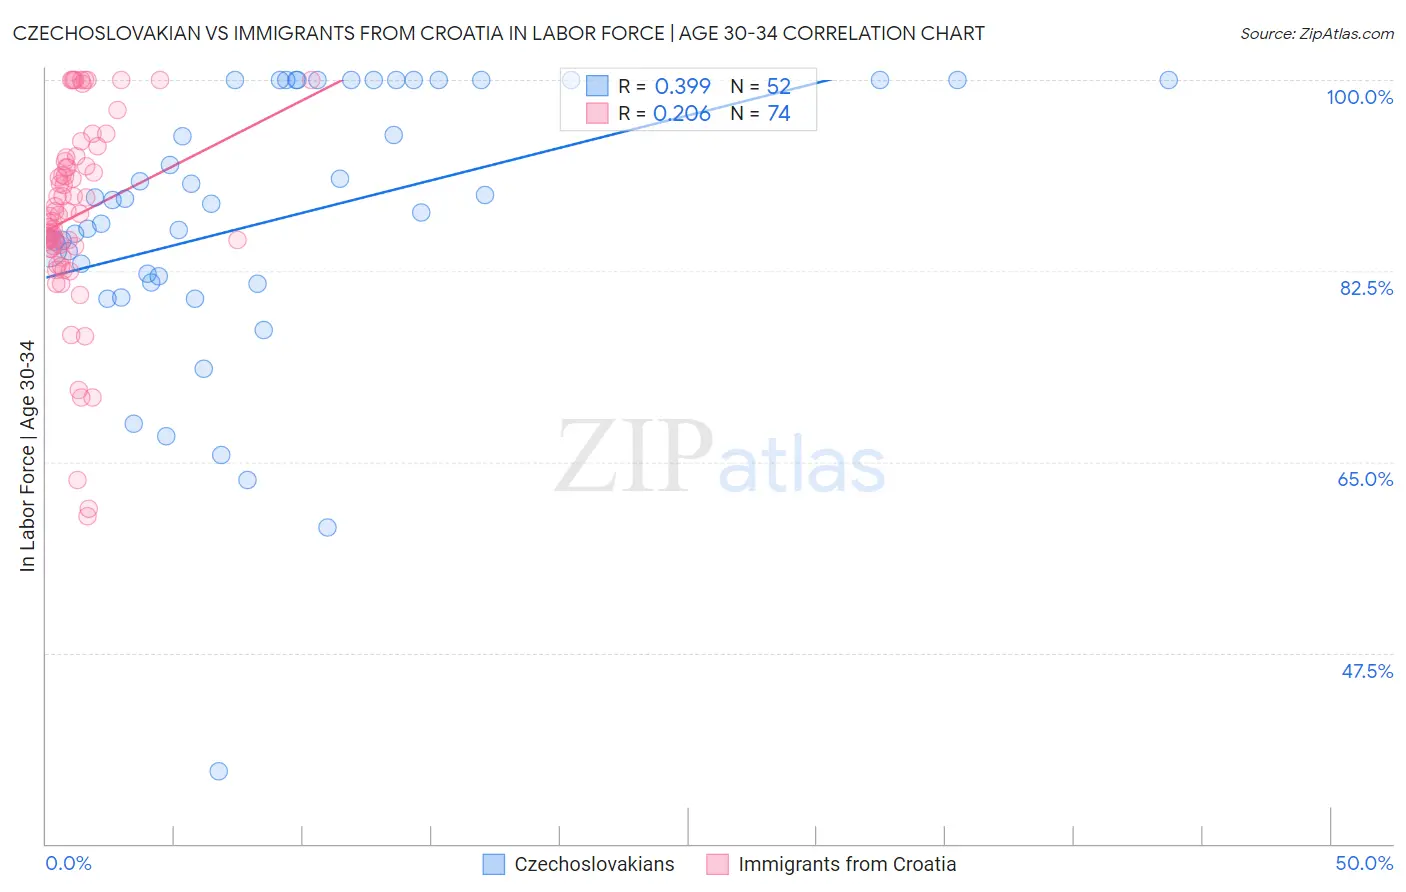
Czechoslovakian vs Immigrants from Croatia In Labor Force | Age 30-34 Correlation Chart
The statistical analysis conducted on geographies consisting of 368,454,480 people shows a mild positive correlation between the proportion of Czechoslovakians and labor force participation rate among population between the ages 30 and 34 in the United States with a correlation coefficient (R) of 0.399 and weighted average of 84.8%. Similarly, the statistical analysis conducted on geographies consisting of 132,558,234 people shows a weak positive correlation between the proportion of Immigrants from Croatia and labor force participation rate among population between the ages 30 and 34 in the United States with a correlation coefficient (R) of 0.206 and weighted average of 86.1%, a difference of 1.6%.
In Labor Force | Age 30-34 Correlation Summary
| Measurement | Czechoslovakian | Immigrants from Croatia |
| Minimum | 36.7% | 60.0% |
| Maximum | 100.0% | 100.0% |
| Range | 63.3% | 40.0% |
| Mean | 87.2% | 87.6% |
| Median | 88.9% | 87.7% |
| Interquartile 25% (IQ1) | 81.7% | 84.6% |
| Interquartile 75% (IQ3) | 100.0% | 92.6% |
| Interquartile Range (IQR) | 18.3% | 8.0% |
| Standard Deviation (Sample) | 13.0% | 8.8% |
| Standard Deviation (Population) | 12.8% | 8.8% |
Similar Demographics by In Labor Force | Age 30-34
Demographics Similar to Czechoslovakians by In Labor Force | Age 30-34
In terms of in labor force | age 30-34, the demographic groups most similar to Czechoslovakians are Immigrants from Armenia (84.8%, a difference of 0.010%), Peruvian (84.8%, a difference of 0.020%), Pakistani (84.7%, a difference of 0.020%), Immigrants from Cambodia (84.7%, a difference of 0.020%), and French Canadian (84.8%, a difference of 0.030%).
| Demographics | Rating | Rank | In Labor Force | Age 30-34 |
| Romanians | 73.5 /100 | #152 | Good 84.8% |
| Syrians | 70.1 /100 | #153 | Good 84.8% |
| Northern Europeans | 70.0 /100 | #154 | Good 84.8% |
| Immigrants | Sudan | 69.5 /100 | #155 | Good 84.8% |
| French Canadians | 67.3 /100 | #156 | Good 84.8% |
| Peruvians | 65.9 /100 | #157 | Good 84.8% |
| Immigrants | Armenia | 64.7 /100 | #158 | Good 84.8% |
| Czechoslovakians | 63.0 /100 | #159 | Good 84.8% |
| Pakistanis | 60.8 /100 | #160 | Good 84.7% |
| Immigrants | Cambodia | 60.7 /100 | #161 | Good 84.7% |
| South Americans | 58.7 /100 | #162 | Average 84.7% |
| Immigrants | Uruguay | 57.4 /100 | #163 | Average 84.7% |
| Icelanders | 56.8 /100 | #164 | Average 84.7% |
| Immigrants | Western Europe | 56.7 /100 | #165 | Average 84.7% |
| Afghans | 55.2 /100 | #166 | Average 84.7% |
Demographics Similar to Immigrants from Croatia by In Labor Force | Age 30-34
In terms of in labor force | age 30-34, the demographic groups most similar to Immigrants from Croatia are Bolivian (86.1%, a difference of 0.0%), Immigrants from Cabo Verde (86.1%, a difference of 0.010%), Immigrants from Albania (86.1%, a difference of 0.030%), Latvian (86.0%, a difference of 0.060%), and Immigrants from Cameroon (86.0%, a difference of 0.060%).
| Demographics | Rating | Rank | In Labor Force | Age 30-34 |
| Somalis | 100.0 /100 | #6 | Exceptional 86.2% |
| Immigrants | Bolivia | 100.0 /100 | #7 | Exceptional 86.2% |
| Cambodians | 100.0 /100 | #8 | Exceptional 86.2% |
| Immigrants | Somalia | 100.0 /100 | #9 | Exceptional 86.2% |
| Immigrants | Serbia | 100.0 /100 | #10 | Exceptional 86.2% |
| Carpatho Rusyns | 100.0 /100 | #11 | Exceptional 86.2% |
| Bolivians | 100.0 /100 | #12 | Exceptional 86.1% |
| Immigrants | Croatia | 100.0 /100 | #13 | Exceptional 86.1% |
| Immigrants | Cabo Verde | 100.0 /100 | #14 | Exceptional 86.1% |
| Immigrants | Albania | 100.0 /100 | #15 | Exceptional 86.1% |
| Latvians | 100.0 /100 | #16 | Exceptional 86.0% |
| Immigrants | Cameroon | 100.0 /100 | #17 | Exceptional 86.0% |
| Immigrants | Sierra Leone | 100.0 /100 | #18 | Exceptional 86.0% |
| Sierra Leoneans | 100.0 /100 | #19 | Exceptional 86.0% |
| Bulgarians | 100.0 /100 | #20 | Exceptional 86.0% |