Czechoslovakian vs Hmong In Labor Force | Age 35-44
COMPARE
Czechoslovakian
Hmong
In Labor Force | Age 35-44
In Labor Force | Age 35-44 Comparison
Czechoslovakians
Hmong
84.6%
IN LABOR FORCE | AGE 35-44
82.6/ 100
METRIC RATING
138th/ 347
METRIC RANK
82.6%
IN LABOR FORCE | AGE 35-44
0.0/ 100
METRIC RATING
297th/ 347
METRIC RANK
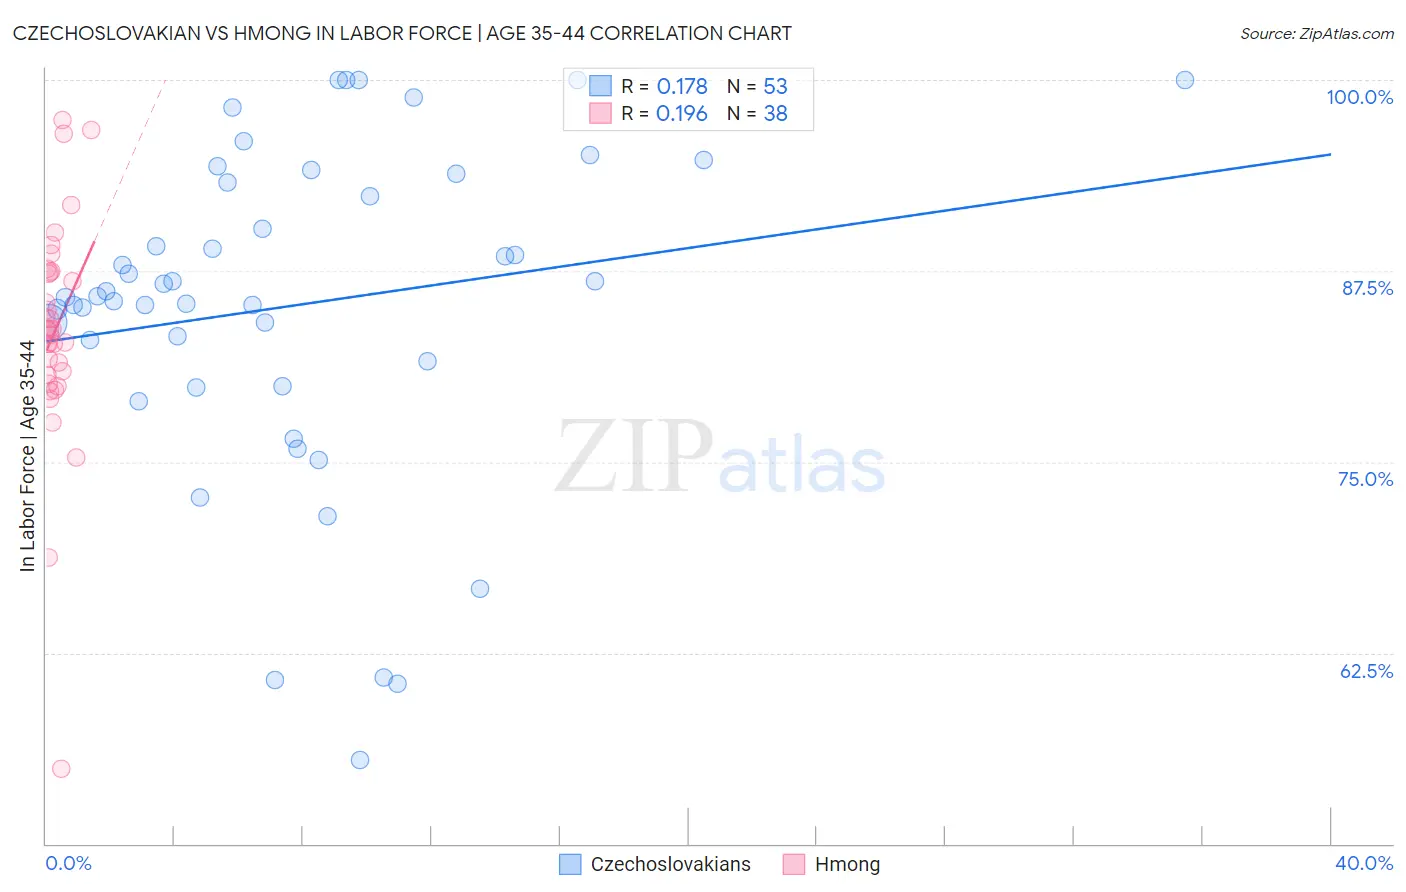
Czechoslovakian vs Hmong In Labor Force | Age 35-44 Correlation Chart
The statistical analysis conducted on geographies consisting of 368,545,873 people shows a poor positive correlation between the proportion of Czechoslovakians and labor force participation rate among population between the ages 35 and 44 in the United States with a correlation coefficient (R) of 0.178 and weighted average of 84.6%. Similarly, the statistical analysis conducted on geographies consisting of 24,669,739 people shows a poor positive correlation between the proportion of Hmong and labor force participation rate among population between the ages 35 and 44 in the United States with a correlation coefficient (R) of 0.196 and weighted average of 82.6%, a difference of 2.4%.
In Labor Force | Age 35-44 Correlation Summary
| Measurement | Czechoslovakian | Hmong |
| Minimum | 55.5% | 54.9% |
| Maximum | 100.0% | 97.4% |
| Range | 44.5% | 42.5% |
| Mean | 85.2% | 83.6% |
| Median | 85.8% | 83.7% |
| Interquartile 25% (IQ1) | 80.8% | 80.7% |
| Interquartile 75% (IQ3) | 93.6% | 87.4% |
| Interquartile Range (IQR) | 12.8% | 6.7% |
| Standard Deviation (Sample) | 10.7% | 7.4% |
| Standard Deviation (Population) | 10.6% | 7.3% |
Similar Demographics by In Labor Force | Age 35-44
Demographics Similar to Czechoslovakians by In Labor Force | Age 35-44
In terms of in labor force | age 35-44, the demographic groups most similar to Czechoslovakians are Immigrants from Zaire (84.6%, a difference of 0.0%), Immigrants from Japan (84.6%, a difference of 0.010%), Immigrants from Chile (84.6%, a difference of 0.020%), Immigrants from Belgium (84.6%, a difference of 0.020%), and Immigrants from Uruguay (84.6%, a difference of 0.030%).
| Demographics | Rating | Rank | In Labor Force | Age 35-44 |
| Immigrants | Scotland | 89.6 /100 | #131 | Excellent 84.7% |
| Austrians | 89.4 /100 | #132 | Excellent 84.7% |
| Argentineans | 88.4 /100 | #133 | Excellent 84.6% |
| Immigrants | Korea | 88.2 /100 | #134 | Excellent 84.6% |
| Immigrants | Malaysia | 87.5 /100 | #135 | Excellent 84.6% |
| Afghans | 86.3 /100 | #136 | Excellent 84.6% |
| Immigrants | Chile | 84.6 /100 | #137 | Excellent 84.6% |
| Czechoslovakians | 82.6 /100 | #138 | Excellent 84.6% |
| Immigrants | Zaire | 82.5 /100 | #139 | Excellent 84.6% |
| Immigrants | Japan | 81.4 /100 | #140 | Excellent 84.6% |
| Immigrants | Belgium | 80.8 /100 | #141 | Excellent 84.6% |
| Immigrants | Uruguay | 80.1 /100 | #142 | Excellent 84.6% |
| Immigrants | Ukraine | 79.7 /100 | #143 | Good 84.6% |
| Immigrants | Jamaica | 79.4 /100 | #144 | Good 84.6% |
| Immigrants | Saudi Arabia | 79.4 /100 | #145 | Good 84.6% |
Demographics Similar to Hmong by In Labor Force | Age 35-44
In terms of in labor force | age 35-44, the demographic groups most similar to Hmong are Mexican American Indian (82.6%, a difference of 0.010%), Ottawa (82.6%, a difference of 0.020%), Tlingit-Haida (82.5%, a difference of 0.030%), Central American Indian (82.5%, a difference of 0.090%), and Immigrants from Lebanon (82.7%, a difference of 0.10%).
| Demographics | Rating | Rank | In Labor Force | Age 35-44 |
| Africans | 0.0 /100 | #290 | Tragic 82.9% |
| Pennsylvania Germans | 0.0 /100 | #291 | Tragic 82.9% |
| Immigrants | Latin America | 0.0 /100 | #292 | Tragic 82.8% |
| Spanish Americans | 0.0 /100 | #293 | Tragic 82.8% |
| Potawatomi | 0.0 /100 | #294 | Tragic 82.7% |
| Immigrants | Lebanon | 0.0 /100 | #295 | Tragic 82.7% |
| Mexican American Indians | 0.0 /100 | #296 | Tragic 82.6% |
| Hmong | 0.0 /100 | #297 | Tragic 82.6% |
| Ottawa | 0.0 /100 | #298 | Tragic 82.6% |
| Tlingit-Haida | 0.0 /100 | #299 | Tragic 82.5% |
| Central American Indians | 0.0 /100 | #300 | Tragic 82.5% |
| Spanish American Indians | 0.0 /100 | #301 | Tragic 82.5% |
| Americans | 0.0 /100 | #302 | Tragic 82.4% |
| Nepalese | 0.0 /100 | #303 | Tragic 82.4% |
| Marshallese | 0.0 /100 | #304 | Tragic 82.4% |