Alaska Native vs Immigrants from Croatia In Labor Force | Age 35-44
COMPARE
Alaska Native
Immigrants from Croatia
In Labor Force | Age 35-44
In Labor Force | Age 35-44 Comparison
Alaska Natives
Immigrants from Croatia
81.6%
IN LABOR FORCE | AGE 35-44
0.0/ 100
METRIC RATING
312th/ 347
METRIC RANK
85.1%
IN LABOR FORCE | AGE 35-44
99.5/ 100
METRIC RATING
56th/ 347
METRIC RANK
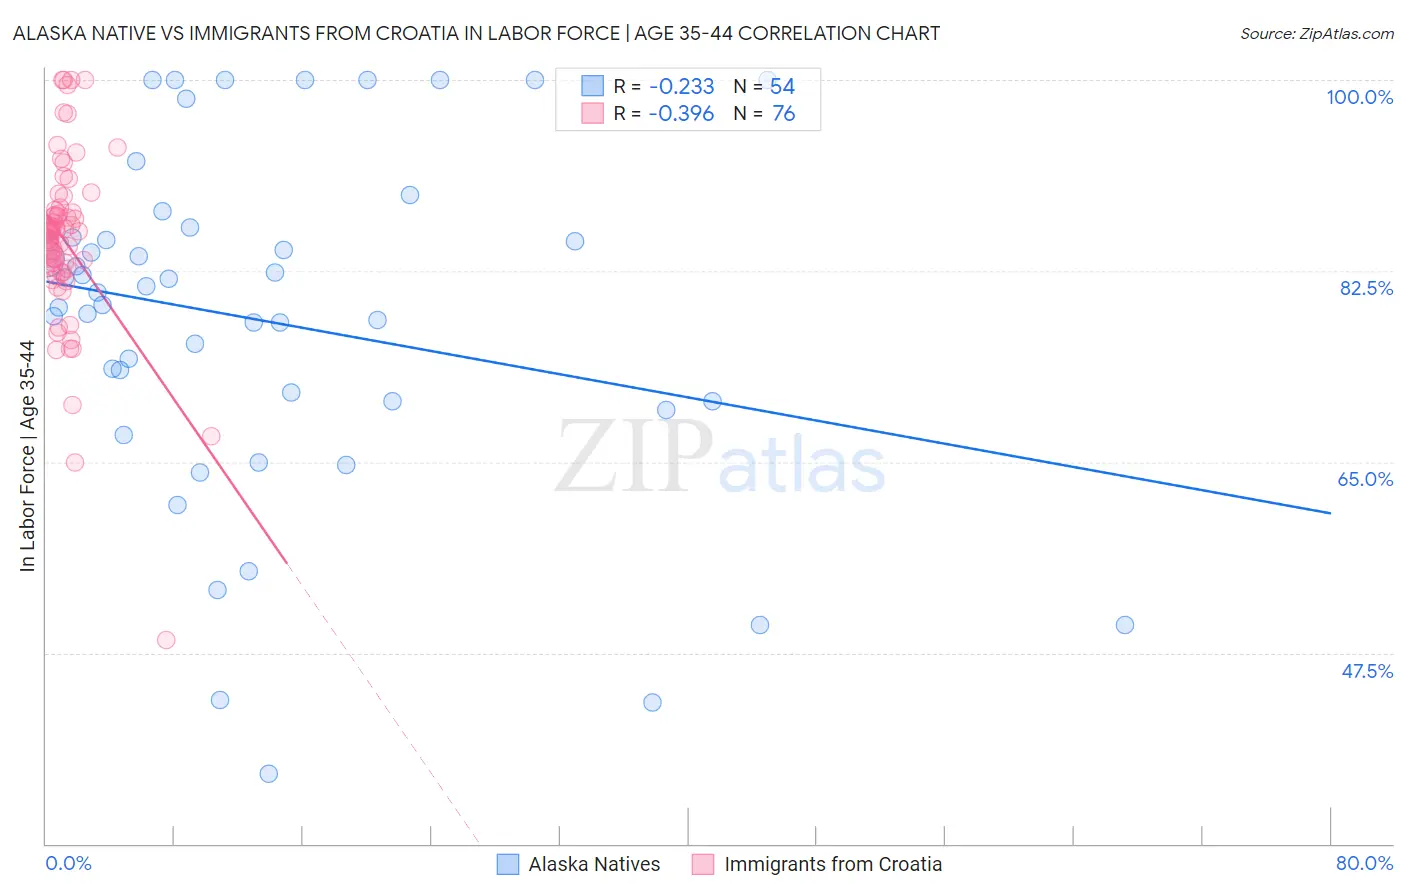
Alaska Native vs Immigrants from Croatia In Labor Force | Age 35-44 Correlation Chart
The statistical analysis conducted on geographies consisting of 76,764,235 people shows a weak negative correlation between the proportion of Alaska Natives and labor force participation rate among population between the ages 35 and 44 in the United States with a correlation coefficient (R) of -0.233 and weighted average of 81.6%. Similarly, the statistical analysis conducted on geographies consisting of 132,569,777 people shows a mild negative correlation between the proportion of Immigrants from Croatia and labor force participation rate among population between the ages 35 and 44 in the United States with a correlation coefficient (R) of -0.396 and weighted average of 85.1%, a difference of 4.3%.
In Labor Force | Age 35-44 Correlation Summary
| Measurement | Alaska Native | Immigrants from Croatia |
| Minimum | 36.4% | 48.7% |
| Maximum | 100.0% | 100.0% |
| Range | 63.6% | 51.3% |
| Mean | 77.8% | 85.3% |
| Median | 79.9% | 86.1% |
| Interquartile 25% (IQ1) | 70.5% | 82.8% |
| Interquartile 75% (IQ3) | 85.5% | 87.9% |
| Interquartile Range (IQR) | 15.0% | 5.2% |
| Standard Deviation (Sample) | 15.9% | 8.1% |
| Standard Deviation (Population) | 15.7% | 8.0% |
Similar Demographics by In Labor Force | Age 35-44
Demographics Similar to Alaska Natives by In Labor Force | Age 35-44
In terms of in labor force | age 35-44, the demographic groups most similar to Alaska Natives are Mexican (81.6%, a difference of 0.0%), Cajun (81.5%, a difference of 0.12%), Colville (81.7%, a difference of 0.14%), Immigrants from Mexico (81.5%, a difference of 0.14%), and Comanche (81.5%, a difference of 0.16%).
| Demographics | Rating | Rank | In Labor Force | Age 35-44 |
| Shoshone | 0.0 /100 | #305 | Tragic 82.2% |
| Blacks/African Americans | 0.0 /100 | #306 | Tragic 82.2% |
| Hispanics or Latinos | 0.0 /100 | #307 | Tragic 82.1% |
| Immigrants | Central America | 0.0 /100 | #308 | Tragic 82.0% |
| Cree | 0.0 /100 | #309 | Tragic 82.0% |
| Blackfeet | 0.0 /100 | #310 | Tragic 81.9% |
| Colville | 0.0 /100 | #311 | Tragic 81.7% |
| Alaska Natives | 0.0 /100 | #312 | Tragic 81.6% |
| Mexicans | 0.0 /100 | #313 | Tragic 81.6% |
| Cajuns | 0.0 /100 | #314 | Tragic 81.5% |
| Immigrants | Mexico | 0.0 /100 | #315 | Tragic 81.5% |
| Comanche | 0.0 /100 | #316 | Tragic 81.5% |
| Cherokee | 0.0 /100 | #317 | Tragic 81.4% |
| Alaskan Athabascans | 0.0 /100 | #318 | Tragic 81.3% |
| Inupiat | 0.0 /100 | #319 | Tragic 80.9% |
Demographics Similar to Immigrants from Croatia by In Labor Force | Age 35-44
In terms of in labor force | age 35-44, the demographic groups most similar to Immigrants from Croatia are Turkish (85.1%, a difference of 0.010%), Soviet Union (85.1%, a difference of 0.010%), Chinese (85.1%, a difference of 0.020%), Slovak (85.1%, a difference of 0.020%), and Serbian (85.1%, a difference of 0.020%).
| Demographics | Rating | Rank | In Labor Force | Age 35-44 |
| Croatians | 99.7 /100 | #49 | Exceptional 85.2% |
| Thais | 99.7 /100 | #50 | Exceptional 85.2% |
| Immigrants | Albania | 99.7 /100 | #51 | Exceptional 85.1% |
| Immigrants | Kenya | 99.6 /100 | #52 | Exceptional 85.1% |
| Taiwanese | 99.6 /100 | #53 | Exceptional 85.1% |
| Turks | 99.5 /100 | #54 | Exceptional 85.1% |
| Soviet Union | 99.5 /100 | #55 | Exceptional 85.1% |
| Immigrants | Croatia | 99.5 /100 | #56 | Exceptional 85.1% |
| Chinese | 99.4 /100 | #57 | Exceptional 85.1% |
| Slovaks | 99.4 /100 | #58 | Exceptional 85.1% |
| Serbians | 99.4 /100 | #59 | Exceptional 85.1% |
| Albanians | 99.4 /100 | #60 | Exceptional 85.1% |
| Immigrants | Latvia | 99.3 /100 | #61 | Exceptional 85.0% |
| Immigrants | Moldova | 99.3 /100 | #62 | Exceptional 85.0% |
| Immigrants | Uganda | 99.3 /100 | #63 | Exceptional 85.0% |