Cuban vs Immigrants from Laos In Labor Force | Age 16-19
COMPARE
Cuban
Immigrants from Laos
In Labor Force | Age 16-19
In Labor Force | Age 16-19 Comparison
Cubans
Immigrants from Laos
31.8%
IN LABOR FORCE | AGE 16-19
0.0/ 100
METRIC RATING
314th/ 347
METRIC RANK
40.6%
IN LABOR FORCE | AGE 16-19
100.0/ 100
METRIC RATING
52nd/ 347
METRIC RANK
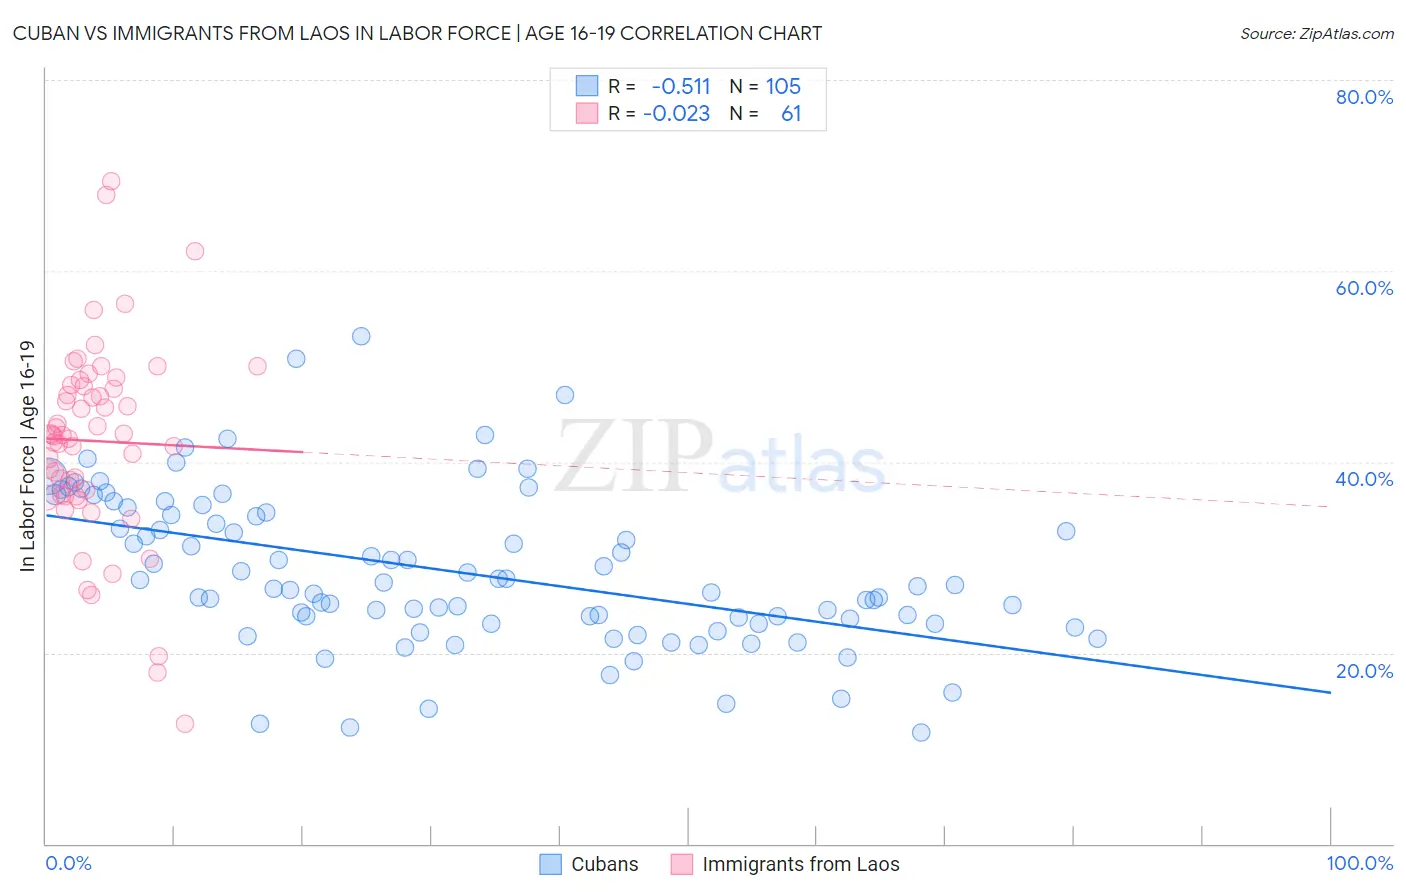
Cuban vs Immigrants from Laos In Labor Force | Age 16-19 Correlation Chart
The statistical analysis conducted on geographies consisting of 448,345,654 people shows a substantial negative correlation between the proportion of Cubans and labor force participation rate among population between the ages 16 and 19 in the United States with a correlation coefficient (R) of -0.511 and weighted average of 31.8%. Similarly, the statistical analysis conducted on geographies consisting of 201,366,524 people shows no correlation between the proportion of Immigrants from Laos and labor force participation rate among population between the ages 16 and 19 in the United States with a correlation coefficient (R) of -0.023 and weighted average of 40.6%, a difference of 27.9%.
In Labor Force | Age 16-19 Correlation Summary
| Measurement | Cuban | Immigrants from Laos |
| Minimum | 11.7% | 12.6% |
| Maximum | 53.2% | 69.4% |
| Range | 41.5% | 56.8% |
| Mean | 28.5% | 42.2% |
| Median | 27.0% | 42.8% |
| Interquartile 25% (IQ1) | 23.0% | 36.5% |
| Interquartile 75% (IQ3) | 34.6% | 48.0% |
| Interquartile Range (IQR) | 11.6% | 11.5% |
| Standard Deviation (Sample) | 8.1% | 10.3% |
| Standard Deviation (Population) | 8.1% | 10.3% |
Similar Demographics by In Labor Force | Age 16-19
Demographics Similar to Cubans by In Labor Force | Age 16-19
In terms of in labor force | age 16-19, the demographic groups most similar to Cubans are Immigrants from Belize (31.8%, a difference of 0.16%), Hopi (31.8%, a difference of 0.16%), Immigrants from West Indies (31.7%, a difference of 0.18%), Filipino (31.7%, a difference of 0.26%), and Indian (Asian) (31.9%, a difference of 0.31%).
| Demographics | Rating | Rank | In Labor Force | Age 16-19 |
| Immigrants | Jamaica | 0.0 /100 | #307 | Tragic 32.2% |
| Navajo | 0.0 /100 | #308 | Tragic 32.1% |
| Immigrants | Eastern Asia | 0.0 /100 | #309 | Tragic 32.0% |
| Immigrants | Iran | 0.0 /100 | #310 | Tragic 32.0% |
| Indians (Asian) | 0.0 /100 | #311 | Tragic 31.9% |
| Immigrants | Belize | 0.0 /100 | #312 | Tragic 31.8% |
| Hopi | 0.0 /100 | #313 | Tragic 31.8% |
| Cubans | 0.0 /100 | #314 | Tragic 31.8% |
| Immigrants | West Indies | 0.0 /100 | #315 | Tragic 31.7% |
| Filipinos | 0.0 /100 | #316 | Tragic 31.7% |
| Immigrants | Nicaragua | 0.0 /100 | #317 | Tragic 31.6% |
| Immigrants | Yemen | 0.0 /100 | #318 | Tragic 31.5% |
| Soviet Union | 0.0 /100 | #319 | Tragic 31.4% |
| Ecuadorians | 0.0 /100 | #320 | Tragic 31.4% |
| West Indians | 0.0 /100 | #321 | Tragic 31.3% |
Demographics Similar to Immigrants from Laos by In Labor Force | Age 16-19
In terms of in labor force | age 16-19, the demographic groups most similar to Immigrants from Laos are Immigrants from Zaire (40.7%, a difference of 0.090%), Indonesian (40.7%, a difference of 0.19%), Immigrants from Kenya (40.5%, a difference of 0.32%), Cree (40.8%, a difference of 0.34%), and Tlingit-Haida (40.5%, a difference of 0.35%).
| Demographics | Rating | Rank | In Labor Force | Age 16-19 |
| Croatians | 100.0 /100 | #45 | Exceptional 41.1% |
| Immigrants | Sudan | 100.0 /100 | #46 | Exceptional 41.0% |
| Carpatho Rusyns | 100.0 /100 | #47 | Exceptional 40.8% |
| Icelanders | 100.0 /100 | #48 | Exceptional 40.8% |
| Cree | 100.0 /100 | #49 | Exceptional 40.8% |
| Indonesians | 100.0 /100 | #50 | Exceptional 40.7% |
| Immigrants | Zaire | 100.0 /100 | #51 | Exceptional 40.7% |
| Immigrants | Laos | 100.0 /100 | #52 | Exceptional 40.6% |
| Immigrants | Kenya | 100.0 /100 | #53 | Exceptional 40.5% |
| Tlingit-Haida | 100.0 /100 | #54 | Exceptional 40.5% |
| British | 100.0 /100 | #55 | Exceptional 40.5% |
| Fijians | 100.0 /100 | #56 | Exceptional 40.4% |
| Lithuanians | 100.0 /100 | #57 | Exceptional 40.4% |
| Aleuts | 100.0 /100 | #58 | Exceptional 40.4% |
| Slavs | 100.0 /100 | #59 | Exceptional 40.4% |