Delaware vs South African In Labor Force | Age 16-19
COMPARE
Delaware
South African
In Labor Force | Age 16-19
In Labor Force | Age 16-19 Comparison
Delaware
South Africans
38.6%
IN LABOR FORCE | AGE 16-19
98.8/ 100
METRIC RATING
106th/ 347
METRIC RANK
36.7%
IN LABOR FORCE | AGE 16-19
58.3/ 100
METRIC RATING
172nd/ 347
METRIC RANK
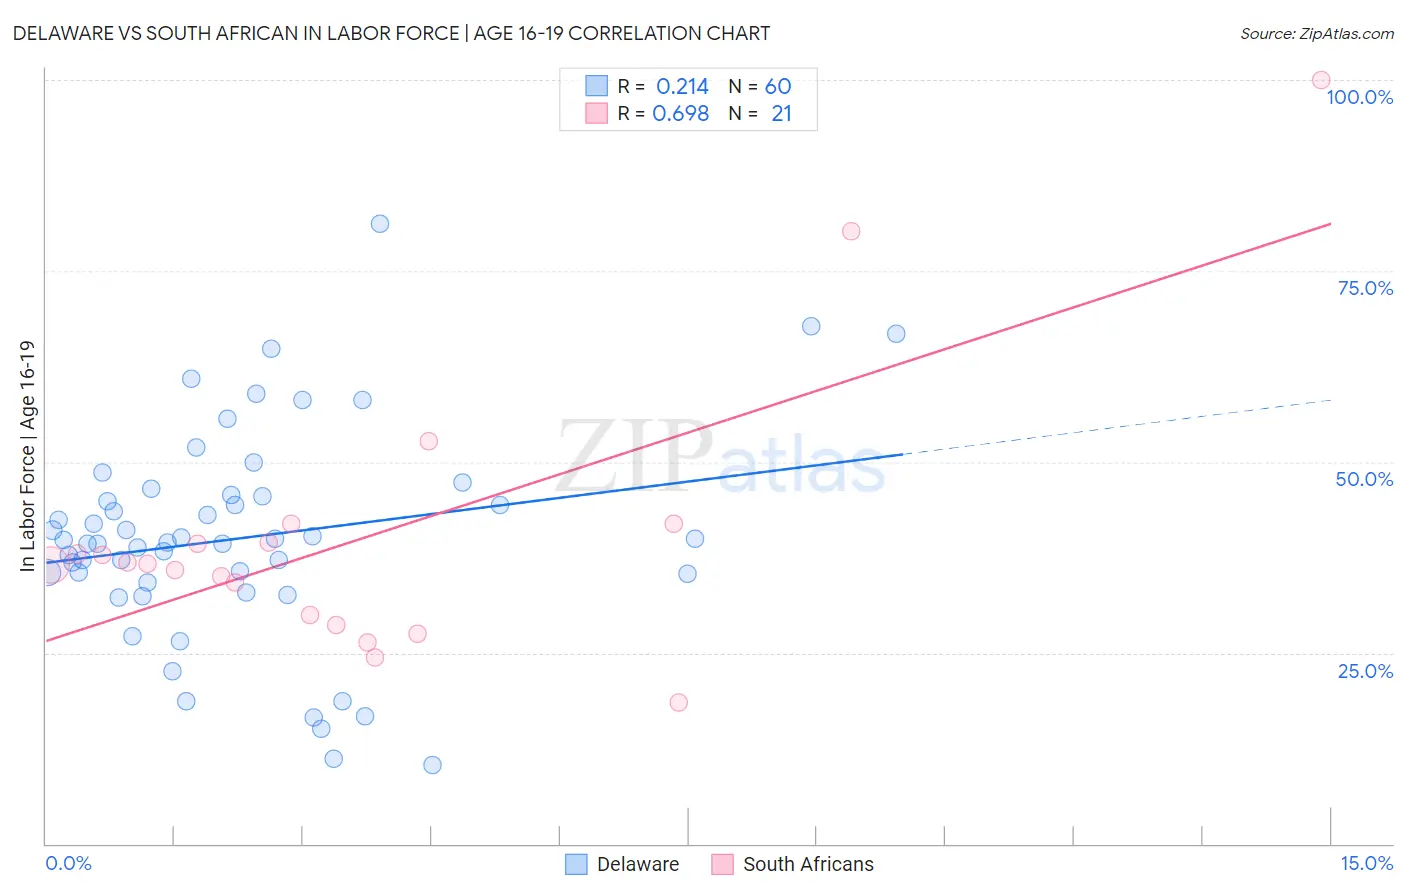
Delaware vs South African In Labor Force | Age 16-19 Correlation Chart
The statistical analysis conducted on geographies consisting of 96,193,348 people shows a weak positive correlation between the proportion of Delaware and labor force participation rate among population between the ages 16 and 19 in the United States with a correlation coefficient (R) of 0.214 and weighted average of 38.6%. Similarly, the statistical analysis conducted on geographies consisting of 182,382,145 people shows a significant positive correlation between the proportion of South Africans and labor force participation rate among population between the ages 16 and 19 in the United States with a correlation coefficient (R) of 0.698 and weighted average of 36.7%, a difference of 5.2%.
In Labor Force | Age 16-19 Correlation Summary
| Measurement | Delaware | South African |
| Minimum | 10.3% | 18.5% |
| Maximum | 81.2% | 100.0% |
| Range | 70.9% | 81.5% |
| Mean | 40.1% | 40.1% |
| Median | 39.6% | 36.7% |
| Interquartile 25% (IQ1) | 34.7% | 29.3% |
| Interquartile 75% (IQ3) | 45.6% | 40.7% |
| Interquartile Range (IQR) | 10.9% | 11.4% |
| Standard Deviation (Sample) | 13.9% | 18.4% |
| Standard Deviation (Population) | 13.8% | 18.0% |
Similar Demographics by In Labor Force | Age 16-19
Demographics Similar to Delaware by In Labor Force | Age 16-19
In terms of in labor force | age 16-19, the demographic groups most similar to Delaware are Iraqi (38.6%, a difference of 0.020%), Chinese (38.6%, a difference of 0.030%), Immigrants from Ethiopia (38.6%, a difference of 0.13%), Lebanese (38.6%, a difference of 0.13%), and Immigrants from Eritrea (38.7%, a difference of 0.17%).
| Demographics | Rating | Rank | In Labor Force | Age 16-19 |
| Immigrants | North Macedonia | 99.3 /100 | #99 | Exceptional 38.9% |
| Immigrants | Thailand | 99.1 /100 | #100 | Exceptional 38.7% |
| Hmong | 99.1 /100 | #101 | Exceptional 38.7% |
| Zimbabweans | 99.1 /100 | #102 | Exceptional 38.7% |
| Immigrants | Cameroon | 99.0 /100 | #103 | Exceptional 38.7% |
| Immigrants | Eritrea | 99.0 /100 | #104 | Exceptional 38.7% |
| Iraqis | 98.9 /100 | #105 | Exceptional 38.6% |
| Delaware | 98.8 /100 | #106 | Exceptional 38.6% |
| Chinese | 98.8 /100 | #107 | Exceptional 38.6% |
| Immigrants | Ethiopia | 98.7 /100 | #108 | Exceptional 38.6% |
| Lebanese | 98.7 /100 | #109 | Exceptional 38.6% |
| Maltese | 98.6 /100 | #110 | Exceptional 38.5% |
| Crow | 98.5 /100 | #111 | Exceptional 38.5% |
| Immigrants | Scotland | 98.5 /100 | #112 | Exceptional 38.5% |
| Sub-Saharan Africans | 98.3 /100 | #113 | Exceptional 38.4% |
Demographics Similar to South Africans by In Labor Force | Age 16-19
In terms of in labor force | age 16-19, the demographic groups most similar to South Africans are Immigrants from Cambodia (36.7%, a difference of 0.010%), Russian (36.7%, a difference of 0.040%), Immigrants from South Africa (36.8%, a difference of 0.11%), Immigrants from Latvia (36.8%, a difference of 0.17%), and Palestinian (36.8%, a difference of 0.25%).
| Demographics | Rating | Rank | In Labor Force | Age 16-19 |
| Yakama | 66.9 /100 | #165 | Good 36.9% |
| Immigrants | Western Africa | 66.7 /100 | #166 | Good 36.9% |
| Arabs | 63.6 /100 | #167 | Good 36.8% |
| Palestinians | 63.1 /100 | #168 | Good 36.8% |
| Immigrants | Latvia | 61.6 /100 | #169 | Good 36.8% |
| Immigrants | South Africa | 60.5 /100 | #170 | Good 36.8% |
| Immigrants | Cambodia | 58.4 /100 | #171 | Average 36.7% |
| South Africans | 58.3 /100 | #172 | Average 36.7% |
| Russians | 57.5 /100 | #173 | Average 36.7% |
| Immigrants | Czechoslovakia | 50.0 /100 | #174 | Average 36.6% |
| Natives/Alaskans | 49.0 /100 | #175 | Average 36.6% |
| Albanians | 48.8 /100 | #176 | Average 36.5% |
| Immigrants | Northern Europe | 46.6 /100 | #177 | Average 36.5% |
| Blacks/African Americans | 45.1 /100 | #178 | Average 36.5% |
| Immigrants | Southern Europe | 43.3 /100 | #179 | Average 36.4% |