Bahamian vs South African In Labor Force | Age 16-19
COMPARE
Bahamian
South African
In Labor Force | Age 16-19
In Labor Force | Age 16-19 Comparison
Bahamians
South Africans
34.6%
IN LABOR FORCE | AGE 16-19
1.4/ 100
METRIC RATING
254th/ 347
METRIC RANK
36.7%
IN LABOR FORCE | AGE 16-19
58.3/ 100
METRIC RATING
172nd/ 347
METRIC RANK
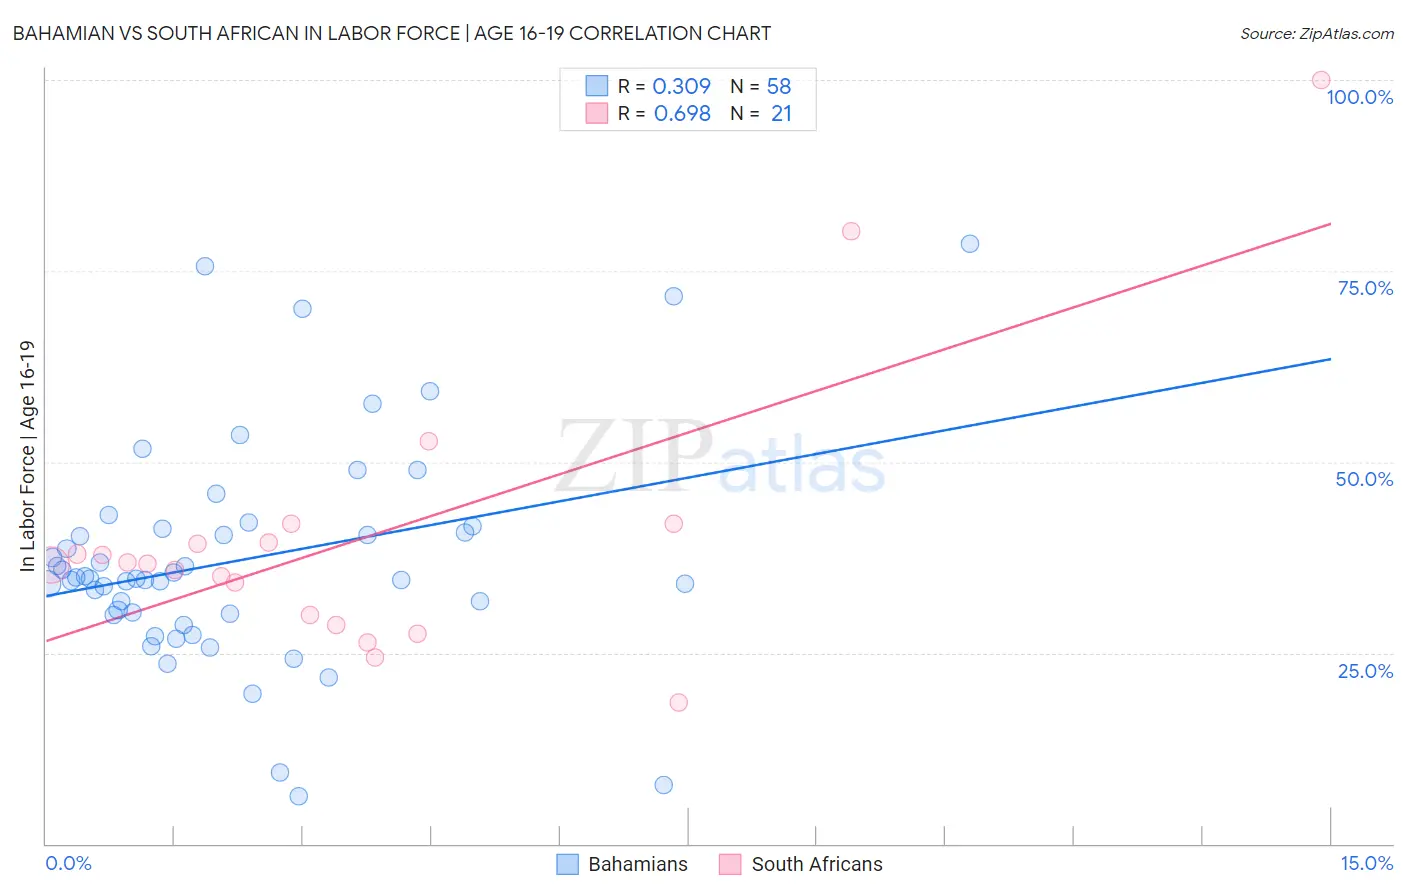
Bahamian vs South African In Labor Force | Age 16-19 Correlation Chart
The statistical analysis conducted on geographies consisting of 112,651,679 people shows a mild positive correlation between the proportion of Bahamians and labor force participation rate among population between the ages 16 and 19 in the United States with a correlation coefficient (R) of 0.309 and weighted average of 34.6%. Similarly, the statistical analysis conducted on geographies consisting of 182,382,145 people shows a significant positive correlation between the proportion of South Africans and labor force participation rate among population between the ages 16 and 19 in the United States with a correlation coefficient (R) of 0.698 and weighted average of 36.7%, a difference of 6.1%.
In Labor Force | Age 16-19 Correlation Summary
| Measurement | Bahamian | South African |
| Minimum | 6.3% | 18.5% |
| Maximum | 78.5% | 100.0% |
| Range | 72.2% | 81.5% |
| Mean | 37.1% | 40.1% |
| Median | 34.6% | 36.7% |
| Interquartile 25% (IQ1) | 30.1% | 29.3% |
| Interquartile 75% (IQ3) | 41.2% | 40.7% |
| Interquartile Range (IQR) | 11.1% | 11.4% |
| Standard Deviation (Sample) | 14.4% | 18.4% |
| Standard Deviation (Population) | 14.3% | 18.0% |
Similar Demographics by In Labor Force | Age 16-19
Demographics Similar to Bahamians by In Labor Force | Age 16-19
In terms of in labor force | age 16-19, the demographic groups most similar to Bahamians are Peruvian (34.6%, a difference of 0.040%), Immigrants from Japan (34.7%, a difference of 0.12%), Immigrants from South Central Asia (34.6%, a difference of 0.15%), Immigrants from Egypt (34.6%, a difference of 0.15%), and Thai (34.6%, a difference of 0.16%).
| Demographics | Rating | Rank | In Labor Force | Age 16-19 |
| Laotians | 2.4 /100 | #247 | Tragic 34.9% |
| Central Americans | 2.2 /100 | #248 | Tragic 34.8% |
| Immigrants | Ukraine | 2.2 /100 | #249 | Tragic 34.8% |
| Immigrants | Pakistan | 2.0 /100 | #250 | Tragic 34.8% |
| Immigrants | Western Asia | 2.0 /100 | #251 | Tragic 34.8% |
| Immigrants | Chile | 2.0 /100 | #252 | Tragic 34.8% |
| Immigrants | Japan | 1.5 /100 | #253 | Tragic 34.7% |
| Bahamians | 1.4 /100 | #254 | Tragic 34.6% |
| Peruvians | 1.4 /100 | #255 | Tragic 34.6% |
| Immigrants | South Central Asia | 1.3 /100 | #256 | Tragic 34.6% |
| Immigrants | Egypt | 1.2 /100 | #257 | Tragic 34.6% |
| Thais | 1.2 /100 | #258 | Tragic 34.6% |
| Immigrants | Immigrants | 1.2 /100 | #259 | Tragic 34.6% |
| Egyptians | 1.2 /100 | #260 | Tragic 34.5% |
| Salvadorans | 1.1 /100 | #261 | Tragic 34.5% |
Demographics Similar to South Africans by In Labor Force | Age 16-19
In terms of in labor force | age 16-19, the demographic groups most similar to South Africans are Immigrants from Cambodia (36.7%, a difference of 0.010%), Russian (36.7%, a difference of 0.040%), Immigrants from South Africa (36.8%, a difference of 0.11%), Immigrants from Latvia (36.8%, a difference of 0.17%), and Palestinian (36.8%, a difference of 0.25%).
| Demographics | Rating | Rank | In Labor Force | Age 16-19 |
| Yakama | 66.9 /100 | #165 | Good 36.9% |
| Immigrants | Western Africa | 66.7 /100 | #166 | Good 36.9% |
| Arabs | 63.6 /100 | #167 | Good 36.8% |
| Palestinians | 63.1 /100 | #168 | Good 36.8% |
| Immigrants | Latvia | 61.6 /100 | #169 | Good 36.8% |
| Immigrants | South Africa | 60.5 /100 | #170 | Good 36.8% |
| Immigrants | Cambodia | 58.4 /100 | #171 | Average 36.7% |
| South Africans | 58.3 /100 | #172 | Average 36.7% |
| Russians | 57.5 /100 | #173 | Average 36.7% |
| Immigrants | Czechoslovakia | 50.0 /100 | #174 | Average 36.6% |
| Natives/Alaskans | 49.0 /100 | #175 | Average 36.6% |
| Albanians | 48.8 /100 | #176 | Average 36.5% |
| Immigrants | Northern Europe | 46.6 /100 | #177 | Average 36.5% |
| Blacks/African Americans | 45.1 /100 | #178 | Average 36.5% |
| Immigrants | Southern Europe | 43.3 /100 | #179 | Average 36.4% |