Cuban vs Bangladeshi In Labor Force | Age 16-19
COMPARE
Cuban
Bangladeshi
In Labor Force | Age 16-19
In Labor Force | Age 16-19 Comparison
Cubans
Bangladeshis
31.8%
IN LABOR FORCE | AGE 16-19
0.0/ 100
METRIC RATING
314th/ 347
METRIC RANK
42.5%
IN LABOR FORCE | AGE 16-19
100.0/ 100
METRIC RATING
24th/ 347
METRIC RANK
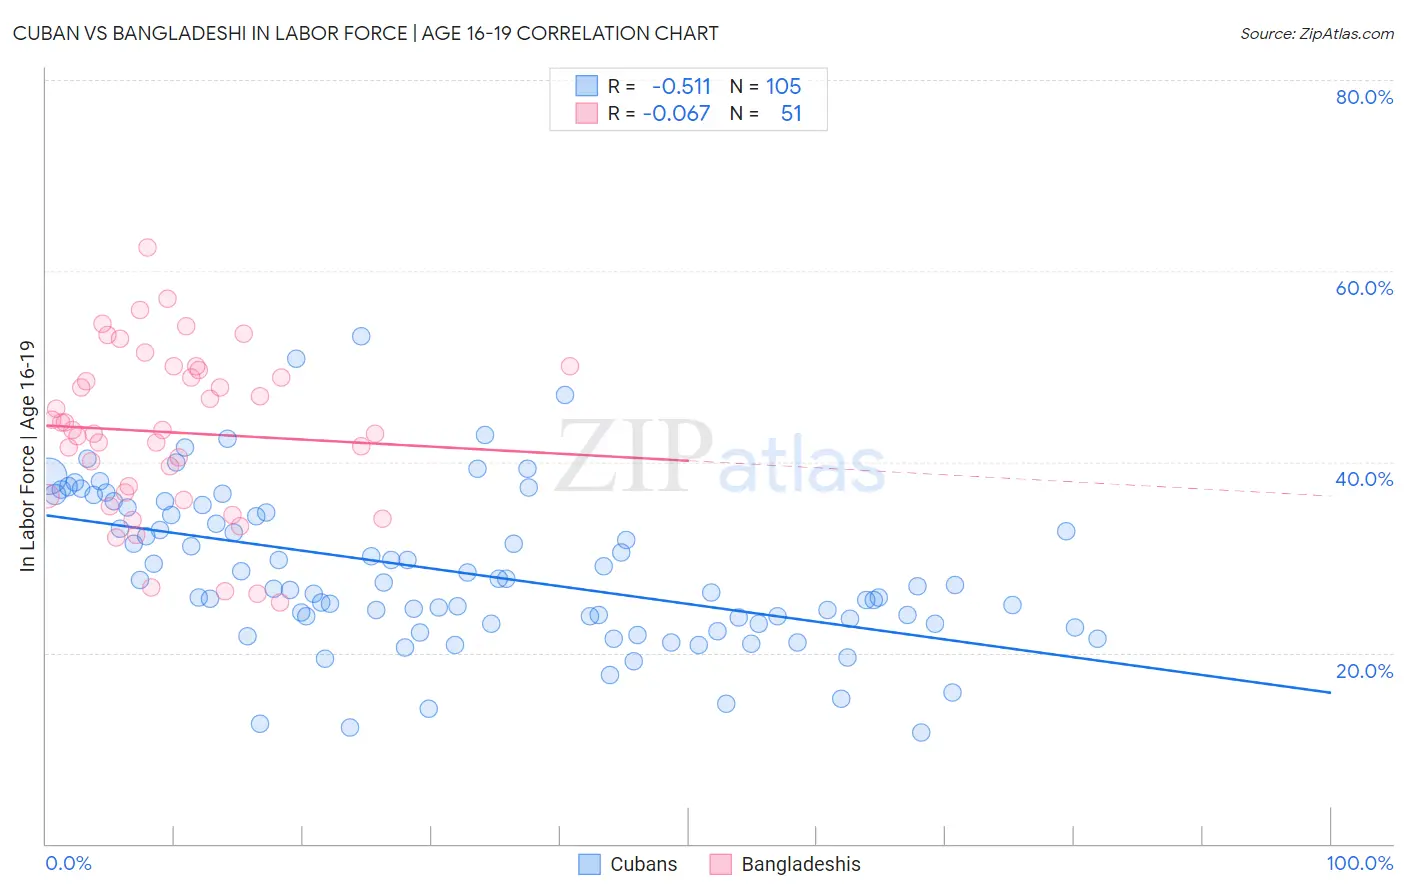
Cuban vs Bangladeshi In Labor Force | Age 16-19 Correlation Chart
The statistical analysis conducted on geographies consisting of 448,345,654 people shows a substantial negative correlation between the proportion of Cubans and labor force participation rate among population between the ages 16 and 19 in the United States with a correlation coefficient (R) of -0.511 and weighted average of 31.8%. Similarly, the statistical analysis conducted on geographies consisting of 141,415,826 people shows a slight negative correlation between the proportion of Bangladeshis and labor force participation rate among population between the ages 16 and 19 in the United States with a correlation coefficient (R) of -0.067 and weighted average of 42.5%, a difference of 33.7%.
In Labor Force | Age 16-19 Correlation Summary
| Measurement | Cuban | Bangladeshi |
| Minimum | 11.7% | 25.3% |
| Maximum | 53.2% | 62.5% |
| Range | 41.5% | 37.2% |
| Mean | 28.5% | 43.1% |
| Median | 27.0% | 43.3% |
| Interquartile 25% (IQ1) | 23.0% | 36.4% |
| Interquartile 75% (IQ3) | 34.6% | 49.6% |
| Interquartile Range (IQR) | 11.6% | 13.2% |
| Standard Deviation (Sample) | 8.1% | 8.6% |
| Standard Deviation (Population) | 8.1% | 8.5% |
Similar Demographics by In Labor Force | Age 16-19
Demographics Similar to Cubans by In Labor Force | Age 16-19
In terms of in labor force | age 16-19, the demographic groups most similar to Cubans are Immigrants from Belize (31.8%, a difference of 0.16%), Hopi (31.8%, a difference of 0.16%), Immigrants from West Indies (31.7%, a difference of 0.18%), Filipino (31.7%, a difference of 0.26%), and Indian (Asian) (31.9%, a difference of 0.31%).
| Demographics | Rating | Rank | In Labor Force | Age 16-19 |
| Immigrants | Jamaica | 0.0 /100 | #307 | Tragic 32.2% |
| Navajo | 0.0 /100 | #308 | Tragic 32.1% |
| Immigrants | Eastern Asia | 0.0 /100 | #309 | Tragic 32.0% |
| Immigrants | Iran | 0.0 /100 | #310 | Tragic 32.0% |
| Indians (Asian) | 0.0 /100 | #311 | Tragic 31.9% |
| Immigrants | Belize | 0.0 /100 | #312 | Tragic 31.8% |
| Hopi | 0.0 /100 | #313 | Tragic 31.8% |
| Cubans | 0.0 /100 | #314 | Tragic 31.8% |
| Immigrants | West Indies | 0.0 /100 | #315 | Tragic 31.7% |
| Filipinos | 0.0 /100 | #316 | Tragic 31.7% |
| Immigrants | Nicaragua | 0.0 /100 | #317 | Tragic 31.6% |
| Immigrants | Yemen | 0.0 /100 | #318 | Tragic 31.5% |
| Soviet Union | 0.0 /100 | #319 | Tragic 31.4% |
| Ecuadorians | 0.0 /100 | #320 | Tragic 31.4% |
| West Indians | 0.0 /100 | #321 | Tragic 31.3% |
Demographics Similar to Bangladeshis by In Labor Force | Age 16-19
In terms of in labor force | age 16-19, the demographic groups most similar to Bangladeshis are German Russian (42.4%, a difference of 0.080%), English (42.4%, a difference of 0.21%), Slovak (42.6%, a difference of 0.33%), Welsh (42.3%, a difference of 0.48%), and Polish (42.1%, a difference of 0.78%).
| Demographics | Rating | Rank | In Labor Force | Age 16-19 |
| Scandinavians | 100.0 /100 | #17 | Exceptional 43.6% |
| French Canadians | 100.0 /100 | #18 | Exceptional 43.6% |
| Belgians | 100.0 /100 | #19 | Exceptional 43.4% |
| Swiss | 100.0 /100 | #20 | Exceptional 43.3% |
| Ottawa | 100.0 /100 | #21 | Exceptional 43.0% |
| Sudanese | 100.0 /100 | #22 | Exceptional 42.9% |
| Slovaks | 100.0 /100 | #23 | Exceptional 42.6% |
| Bangladeshis | 100.0 /100 | #24 | Exceptional 42.5% |
| German Russians | 100.0 /100 | #25 | Exceptional 42.4% |
| English | 100.0 /100 | #26 | Exceptional 42.4% |
| Welsh | 100.0 /100 | #27 | Exceptional 42.3% |
| Poles | 100.0 /100 | #28 | Exceptional 42.1% |
| French | 100.0 /100 | #29 | Exceptional 42.1% |
| Scottish | 100.0 /100 | #30 | Exceptional 42.0% |
| Irish | 100.0 /100 | #31 | Exceptional 42.0% |