Macedonian vs Immigrants from Albania In Labor Force | Age 30-34
COMPARE
Macedonian
Immigrants from Albania
In Labor Force | Age 30-34
In Labor Force | Age 30-34 Comparison
Macedonians
Immigrants from Albania
85.5%
IN LABOR FORCE | AGE 30-34
99.4/ 100
METRIC RATING
63rd/ 347
METRIC RANK
86.1%
IN LABOR FORCE | AGE 30-34
100.0/ 100
METRIC RATING
15th/ 347
METRIC RANK
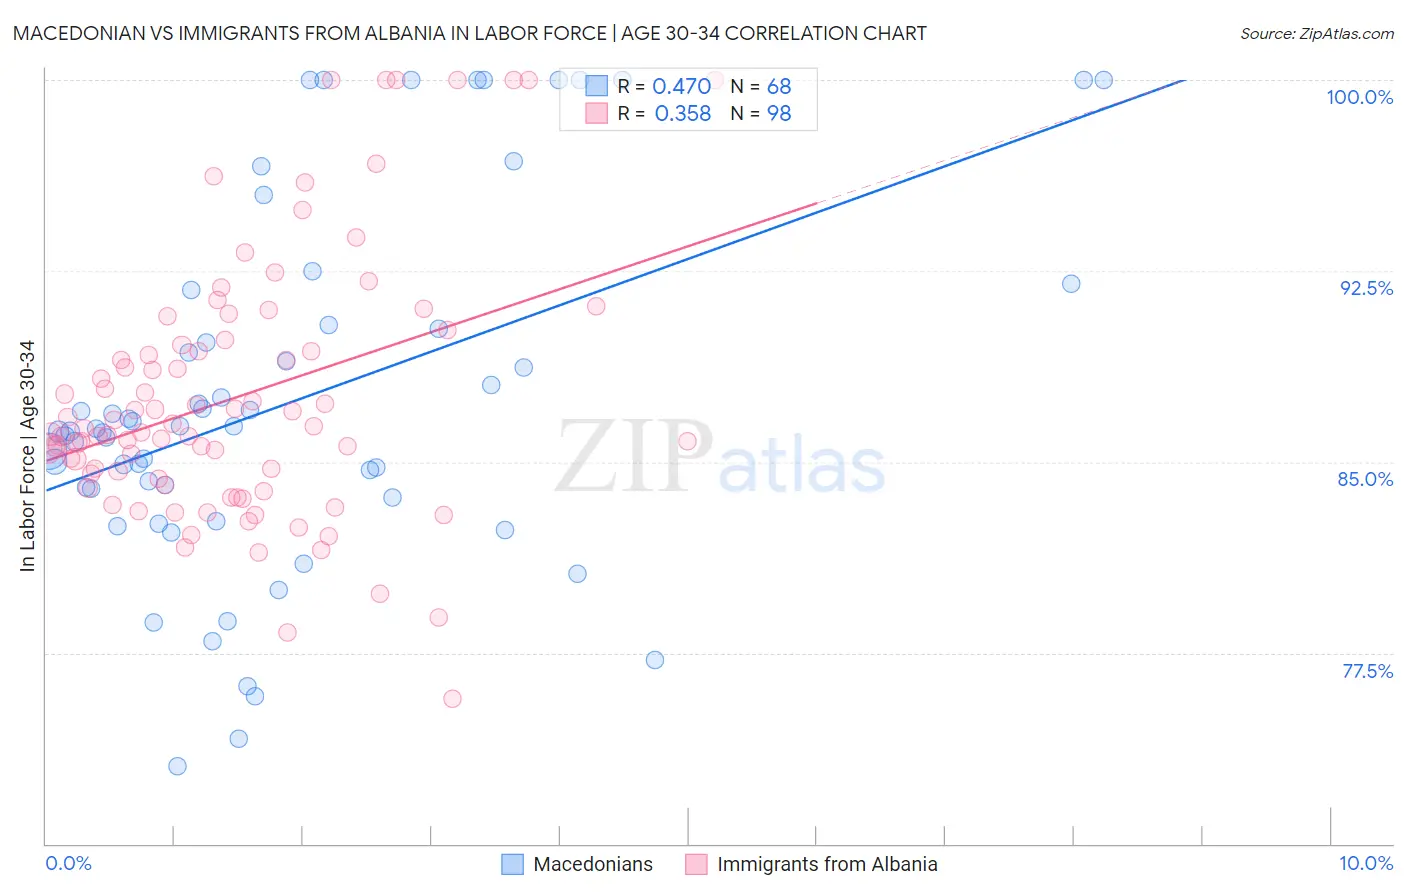
Macedonian vs Immigrants from Albania In Labor Force | Age 30-34 Correlation Chart
The statistical analysis conducted on geographies consisting of 132,641,832 people shows a moderate positive correlation between the proportion of Macedonians and labor force participation rate among population between the ages 30 and 34 in the United States with a correlation coefficient (R) of 0.470 and weighted average of 85.5%. Similarly, the statistical analysis conducted on geographies consisting of 119,375,013 people shows a mild positive correlation between the proportion of Immigrants from Albania and labor force participation rate among population between the ages 30 and 34 in the United States with a correlation coefficient (R) of 0.358 and weighted average of 86.1%, a difference of 0.73%.
In Labor Force | Age 30-34 Correlation Summary
| Measurement | Macedonian | Immigrants from Albania |
| Minimum | 73.0% | 75.7% |
| Maximum | 100.0% | 100.0% |
| Range | 27.0% | 24.3% |
| Mean | 87.4% | 87.5% |
| Median | 86.3% | 86.2% |
| Interquartile 25% (IQ1) | 83.8% | 84.3% |
| Interquartile 75% (IQ3) | 90.3% | 89.6% |
| Interquartile Range (IQR) | 6.5% | 5.3% |
| Standard Deviation (Sample) | 7.0% | 5.1% |
| Standard Deviation (Population) | 7.0% | 5.1% |
Similar Demographics by In Labor Force | Age 30-34
Demographics Similar to Macedonians by In Labor Force | Age 30-34
In terms of in labor force | age 30-34, the demographic groups most similar to Macedonians are Soviet Union (85.5%, a difference of 0.0%), Immigrants from France (85.5%, a difference of 0.010%), Immigrants from Brazil (85.5%, a difference of 0.010%), Italian (85.4%, a difference of 0.010%), and Senegalese (85.4%, a difference of 0.010%).
| Demographics | Rating | Rank | In Labor Force | Age 30-34 |
| Czechs | 99.6 /100 | #56 | Exceptional 85.5% |
| Russians | 99.6 /100 | #57 | Exceptional 85.5% |
| Poles | 99.6 /100 | #58 | Exceptional 85.5% |
| Immigrants | Poland | 99.5 /100 | #59 | Exceptional 85.5% |
| Immigrants | France | 99.5 /100 | #60 | Exceptional 85.5% |
| Immigrants | Brazil | 99.5 /100 | #61 | Exceptional 85.5% |
| Soviet Union | 99.4 /100 | #62 | Exceptional 85.5% |
| Macedonians | 99.4 /100 | #63 | Exceptional 85.5% |
| Italians | 99.4 /100 | #64 | Exceptional 85.4% |
| Senegalese | 99.4 /100 | #65 | Exceptional 85.4% |
| Ghanaians | 99.4 /100 | #66 | Exceptional 85.4% |
| Kenyans | 99.3 /100 | #67 | Exceptional 85.4% |
| Immigrants | Eastern Europe | 99.3 /100 | #68 | Exceptional 85.4% |
| Immigrants | Iran | 99.2 /100 | #69 | Exceptional 85.4% |
| Brazilians | 99.1 /100 | #70 | Exceptional 85.4% |
Demographics Similar to Immigrants from Albania by In Labor Force | Age 30-34
In terms of in labor force | age 30-34, the demographic groups most similar to Immigrants from Albania are Immigrants from Cabo Verde (86.1%, a difference of 0.010%), Bolivian (86.1%, a difference of 0.030%), Immigrants from Croatia (86.1%, a difference of 0.030%), Latvian (86.0%, a difference of 0.030%), and Immigrants from Cameroon (86.0%, a difference of 0.040%).
| Demographics | Rating | Rank | In Labor Force | Age 30-34 |
| Cambodians | 100.0 /100 | #8 | Exceptional 86.2% |
| Immigrants | Somalia | 100.0 /100 | #9 | Exceptional 86.2% |
| Immigrants | Serbia | 100.0 /100 | #10 | Exceptional 86.2% |
| Carpatho Rusyns | 100.0 /100 | #11 | Exceptional 86.2% |
| Bolivians | 100.0 /100 | #12 | Exceptional 86.1% |
| Immigrants | Croatia | 100.0 /100 | #13 | Exceptional 86.1% |
| Immigrants | Cabo Verde | 100.0 /100 | #14 | Exceptional 86.1% |
| Immigrants | Albania | 100.0 /100 | #15 | Exceptional 86.1% |
| Latvians | 100.0 /100 | #16 | Exceptional 86.0% |
| Immigrants | Cameroon | 100.0 /100 | #17 | Exceptional 86.0% |
| Immigrants | Sierra Leone | 100.0 /100 | #18 | Exceptional 86.0% |
| Sierra Leoneans | 100.0 /100 | #19 | Exceptional 86.0% |
| Bulgarians | 100.0 /100 | #20 | Exceptional 86.0% |
| Immigrants | Bulgaria | 100.0 /100 | #21 | Exceptional 86.0% |
| Bermudans | 100.0 /100 | #22 | Exceptional 85.9% |