Immigrants from Australia vs Immigrants from Albania In Labor Force | Age 30-34
COMPARE
Immigrants from Australia
Immigrants from Albania
In Labor Force | Age 30-34
In Labor Force | Age 30-34 Comparison
Immigrants from Australia
Immigrants from Albania
85.6%
IN LABOR FORCE | AGE 30-34
99.8/ 100
METRIC RATING
50th/ 347
METRIC RANK
86.1%
IN LABOR FORCE | AGE 30-34
100.0/ 100
METRIC RATING
15th/ 347
METRIC RANK
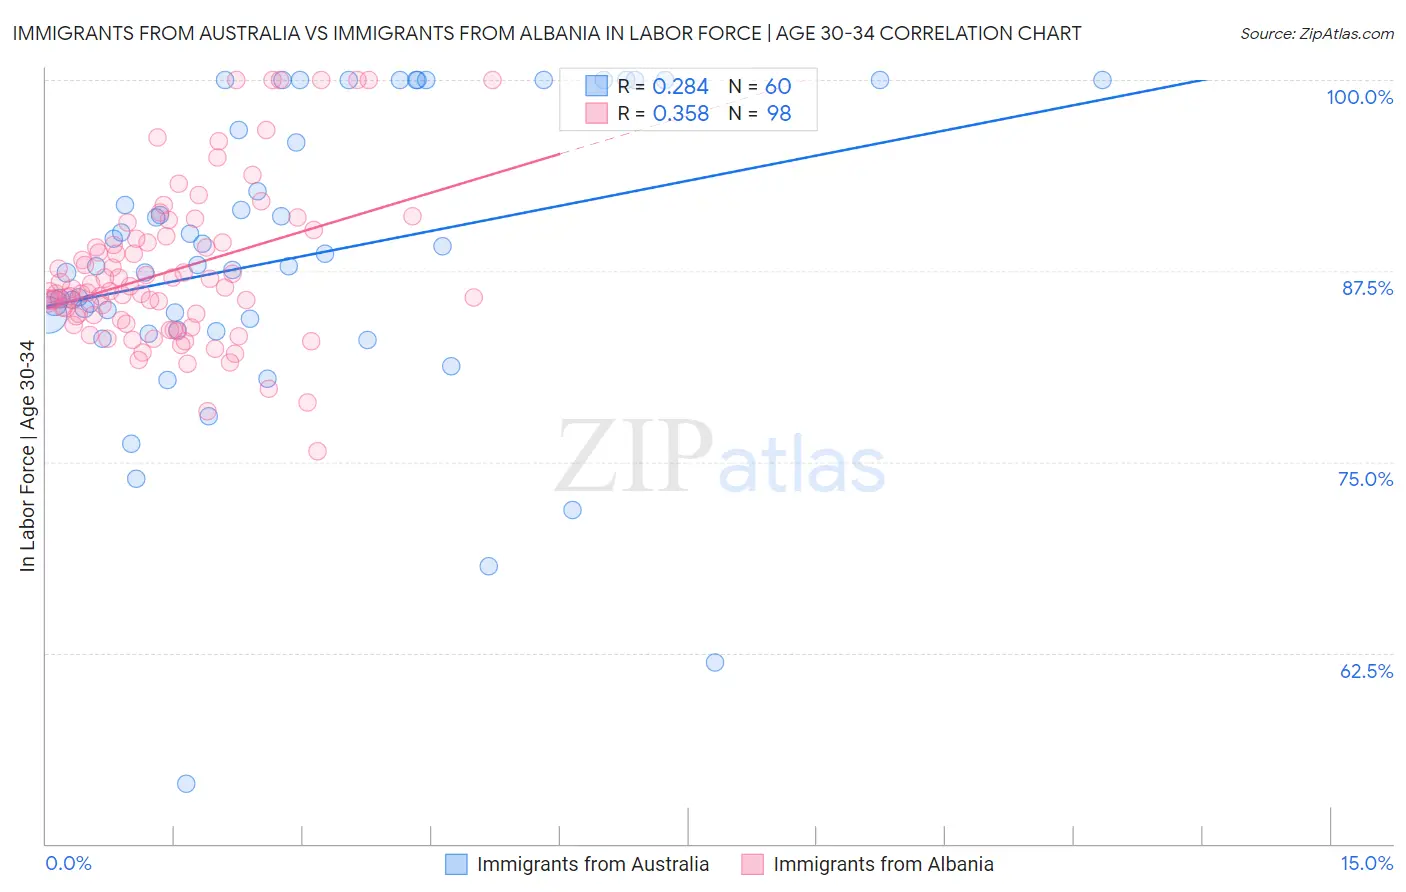
Immigrants from Australia vs Immigrants from Albania In Labor Force | Age 30-34 Correlation Chart
The statistical analysis conducted on geographies consisting of 227,147,173 people shows a weak positive correlation between the proportion of Immigrants from Australia and labor force participation rate among population between the ages 30 and 34 in the United States with a correlation coefficient (R) of 0.284 and weighted average of 85.6%. Similarly, the statistical analysis conducted on geographies consisting of 119,375,013 people shows a mild positive correlation between the proportion of Immigrants from Albania and labor force participation rate among population between the ages 30 and 34 in the United States with a correlation coefficient (R) of 0.358 and weighted average of 86.1%, a difference of 0.58%.
In Labor Force | Age 30-34 Correlation Summary
| Measurement | Immigrants from Australia | Immigrants from Albania |
| Minimum | 53.9% | 75.7% |
| Maximum | 100.0% | 100.0% |
| Range | 46.1% | 24.3% |
| Mean | 88.3% | 87.5% |
| Median | 87.9% | 86.2% |
| Interquartile 25% (IQ1) | 84.0% | 84.3% |
| Interquartile 75% (IQ3) | 98.4% | 89.6% |
| Interquartile Range (IQR) | 14.4% | 5.3% |
| Standard Deviation (Sample) | 9.8% | 5.1% |
| Standard Deviation (Population) | 9.7% | 5.1% |
Similar Demographics by In Labor Force | Age 30-34
Demographics Similar to Immigrants from Australia by In Labor Force | Age 30-34
In terms of in labor force | age 30-34, the demographic groups most similar to Immigrants from Australia are Immigrants from Sweden (85.6%, a difference of 0.010%), Lithuanian (85.6%, a difference of 0.010%), Cape Verdean (85.6%, a difference of 0.020%), Immigrants from Morocco (85.6%, a difference of 0.030%), and Croatian (85.6%, a difference of 0.030%).
| Demographics | Rating | Rank | In Labor Force | Age 30-34 |
| Immigrants | Lithuania | 99.8 /100 | #43 | Exceptional 85.6% |
| Immigrants | Sri Lanka | 99.8 /100 | #44 | Exceptional 85.6% |
| Immigrants | Nepal | 99.8 /100 | #45 | Exceptional 85.6% |
| Immigrants | Morocco | 99.8 /100 | #46 | Exceptional 85.6% |
| Croatians | 99.8 /100 | #47 | Exceptional 85.6% |
| Immigrants | Sweden | 99.8 /100 | #48 | Exceptional 85.6% |
| Lithuanians | 99.8 /100 | #49 | Exceptional 85.6% |
| Immigrants | Australia | 99.8 /100 | #50 | Exceptional 85.6% |
| Cape Verdeans | 99.7 /100 | #51 | Exceptional 85.6% |
| Slovenes | 99.7 /100 | #52 | Exceptional 85.6% |
| Filipinos | 99.6 /100 | #53 | Exceptional 85.5% |
| Immigrants | Kenya | 99.6 /100 | #54 | Exceptional 85.5% |
| Immigrants | Turkey | 99.6 /100 | #55 | Exceptional 85.5% |
| Czechs | 99.6 /100 | #56 | Exceptional 85.5% |
| Russians | 99.6 /100 | #57 | Exceptional 85.5% |
Demographics Similar to Immigrants from Albania by In Labor Force | Age 30-34
In terms of in labor force | age 30-34, the demographic groups most similar to Immigrants from Albania are Immigrants from Cabo Verde (86.1%, a difference of 0.010%), Bolivian (86.1%, a difference of 0.030%), Immigrants from Croatia (86.1%, a difference of 0.030%), Latvian (86.0%, a difference of 0.030%), and Immigrants from Cameroon (86.0%, a difference of 0.040%).
| Demographics | Rating | Rank | In Labor Force | Age 30-34 |
| Cambodians | 100.0 /100 | #8 | Exceptional 86.2% |
| Immigrants | Somalia | 100.0 /100 | #9 | Exceptional 86.2% |
| Immigrants | Serbia | 100.0 /100 | #10 | Exceptional 86.2% |
| Carpatho Rusyns | 100.0 /100 | #11 | Exceptional 86.2% |
| Bolivians | 100.0 /100 | #12 | Exceptional 86.1% |
| Immigrants | Croatia | 100.0 /100 | #13 | Exceptional 86.1% |
| Immigrants | Cabo Verde | 100.0 /100 | #14 | Exceptional 86.1% |
| Immigrants | Albania | 100.0 /100 | #15 | Exceptional 86.1% |
| Latvians | 100.0 /100 | #16 | Exceptional 86.0% |
| Immigrants | Cameroon | 100.0 /100 | #17 | Exceptional 86.0% |
| Immigrants | Sierra Leone | 100.0 /100 | #18 | Exceptional 86.0% |
| Sierra Leoneans | 100.0 /100 | #19 | Exceptional 86.0% |
| Bulgarians | 100.0 /100 | #20 | Exceptional 86.0% |
| Immigrants | Bulgaria | 100.0 /100 | #21 | Exceptional 86.0% |
| Bermudans | 100.0 /100 | #22 | Exceptional 85.9% |