Immigrants from Italy vs Immigrants from Albania In Labor Force | Age 30-34
COMPARE
Immigrants from Italy
Immigrants from Albania
In Labor Force | Age 30-34
In Labor Force | Age 30-34 Comparison
Immigrants from Italy
Immigrants from Albania
85.7%
IN LABOR FORCE | AGE 30-34
99.9/ 100
METRIC RATING
41st/ 347
METRIC RANK
86.1%
IN LABOR FORCE | AGE 30-34
100.0/ 100
METRIC RATING
15th/ 347
METRIC RANK
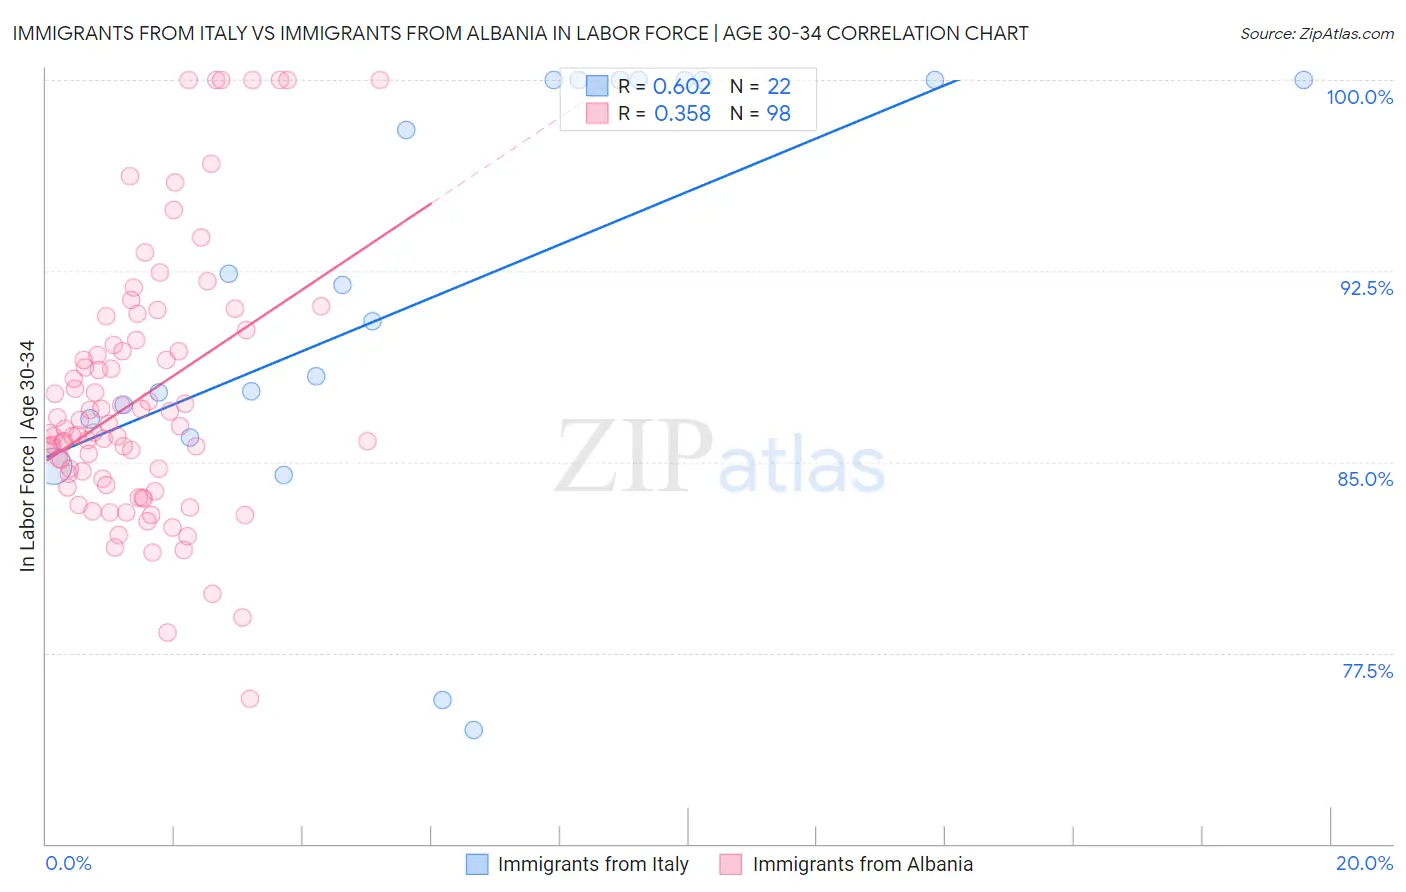
Immigrants from Italy vs Immigrants from Albania In Labor Force | Age 30-34 Correlation Chart
The statistical analysis conducted on geographies consisting of 324,081,928 people shows a significant positive correlation between the proportion of Immigrants from Italy and labor force participation rate among population between the ages 30 and 34 in the United States with a correlation coefficient (R) of 0.602 and weighted average of 85.7%. Similarly, the statistical analysis conducted on geographies consisting of 119,375,013 people shows a mild positive correlation between the proportion of Immigrants from Albania and labor force participation rate among population between the ages 30 and 34 in the United States with a correlation coefficient (R) of 0.358 and weighted average of 86.1%, a difference of 0.50%.
In Labor Force | Age 30-34 Correlation Summary
| Measurement | Immigrants from Italy | Immigrants from Albania |
| Minimum | 74.5% | 75.7% |
| Maximum | 100.0% | 100.0% |
| Range | 25.5% | 24.3% |
| Mean | 91.6% | 87.5% |
| Median | 91.3% | 86.2% |
| Interquartile 25% (IQ1) | 86.7% | 84.3% |
| Interquartile 75% (IQ3) | 100.0% | 89.6% |
| Interquartile Range (IQR) | 13.3% | 5.3% |
| Standard Deviation (Sample) | 8.1% | 5.1% |
| Standard Deviation (Population) | 7.9% | 5.1% |
Similar Demographics by In Labor Force | Age 30-34
Demographics Similar to Immigrants from Italy by In Labor Force | Age 30-34
In terms of in labor force | age 30-34, the demographic groups most similar to Immigrants from Italy are Zimbabwean (85.6%, a difference of 0.010%), Immigrants from Lithuania (85.6%, a difference of 0.010%), Turkish (85.7%, a difference of 0.030%), Immigrants from Sri Lanka (85.6%, a difference of 0.040%), and Immigrants from Nepal (85.6%, a difference of 0.040%).
| Demographics | Rating | Rank | In Labor Force | Age 30-34 |
| Ugandans | 99.9 /100 | #34 | Exceptional 85.8% |
| Serbians | 99.9 /100 | #35 | Exceptional 85.8% |
| Albanians | 99.9 /100 | #36 | Exceptional 85.7% |
| Norwegians | 99.9 /100 | #37 | Exceptional 85.7% |
| Immigrants | Greece | 99.9 /100 | #38 | Exceptional 85.7% |
| Eastern Europeans | 99.9 /100 | #39 | Exceptional 85.7% |
| Turks | 99.9 /100 | #40 | Exceptional 85.7% |
| Immigrants | Italy | 99.9 /100 | #41 | Exceptional 85.7% |
| Zimbabweans | 99.8 /100 | #42 | Exceptional 85.6% |
| Immigrants | Lithuania | 99.8 /100 | #43 | Exceptional 85.6% |
| Immigrants | Sri Lanka | 99.8 /100 | #44 | Exceptional 85.6% |
| Immigrants | Nepal | 99.8 /100 | #45 | Exceptional 85.6% |
| Immigrants | Morocco | 99.8 /100 | #46 | Exceptional 85.6% |
| Croatians | 99.8 /100 | #47 | Exceptional 85.6% |
| Immigrants | Sweden | 99.8 /100 | #48 | Exceptional 85.6% |
Demographics Similar to Immigrants from Albania by In Labor Force | Age 30-34
In terms of in labor force | age 30-34, the demographic groups most similar to Immigrants from Albania are Immigrants from Cabo Verde (86.1%, a difference of 0.010%), Bolivian (86.1%, a difference of 0.030%), Immigrants from Croatia (86.1%, a difference of 0.030%), Latvian (86.0%, a difference of 0.030%), and Immigrants from Cameroon (86.0%, a difference of 0.040%).
| Demographics | Rating | Rank | In Labor Force | Age 30-34 |
| Cambodians | 100.0 /100 | #8 | Exceptional 86.2% |
| Immigrants | Somalia | 100.0 /100 | #9 | Exceptional 86.2% |
| Immigrants | Serbia | 100.0 /100 | #10 | Exceptional 86.2% |
| Carpatho Rusyns | 100.0 /100 | #11 | Exceptional 86.2% |
| Bolivians | 100.0 /100 | #12 | Exceptional 86.1% |
| Immigrants | Croatia | 100.0 /100 | #13 | Exceptional 86.1% |
| Immigrants | Cabo Verde | 100.0 /100 | #14 | Exceptional 86.1% |
| Immigrants | Albania | 100.0 /100 | #15 | Exceptional 86.1% |
| Latvians | 100.0 /100 | #16 | Exceptional 86.0% |
| Immigrants | Cameroon | 100.0 /100 | #17 | Exceptional 86.0% |
| Immigrants | Sierra Leone | 100.0 /100 | #18 | Exceptional 86.0% |
| Sierra Leoneans | 100.0 /100 | #19 | Exceptional 86.0% |
| Bulgarians | 100.0 /100 | #20 | Exceptional 86.0% |
| Immigrants | Bulgaria | 100.0 /100 | #21 | Exceptional 86.0% |
| Bermudans | 100.0 /100 | #22 | Exceptional 85.9% |