Creek vs Immigrants from Kazakhstan In Labor Force | Age > 16
COMPARE
Creek
Immigrants from Kazakhstan
In Labor Force | Age > 16
In Labor Force | Age > 16 Comparison
Creek
Immigrants from Kazakhstan
61.3%
IN LABOR FORCE | AGE > 16
0.0/ 100
METRIC RATING
330th/ 347
METRIC RANK
65.3%
IN LABOR FORCE | AGE > 16
68.1/ 100
METRIC RATING
165th/ 347
METRIC RANK
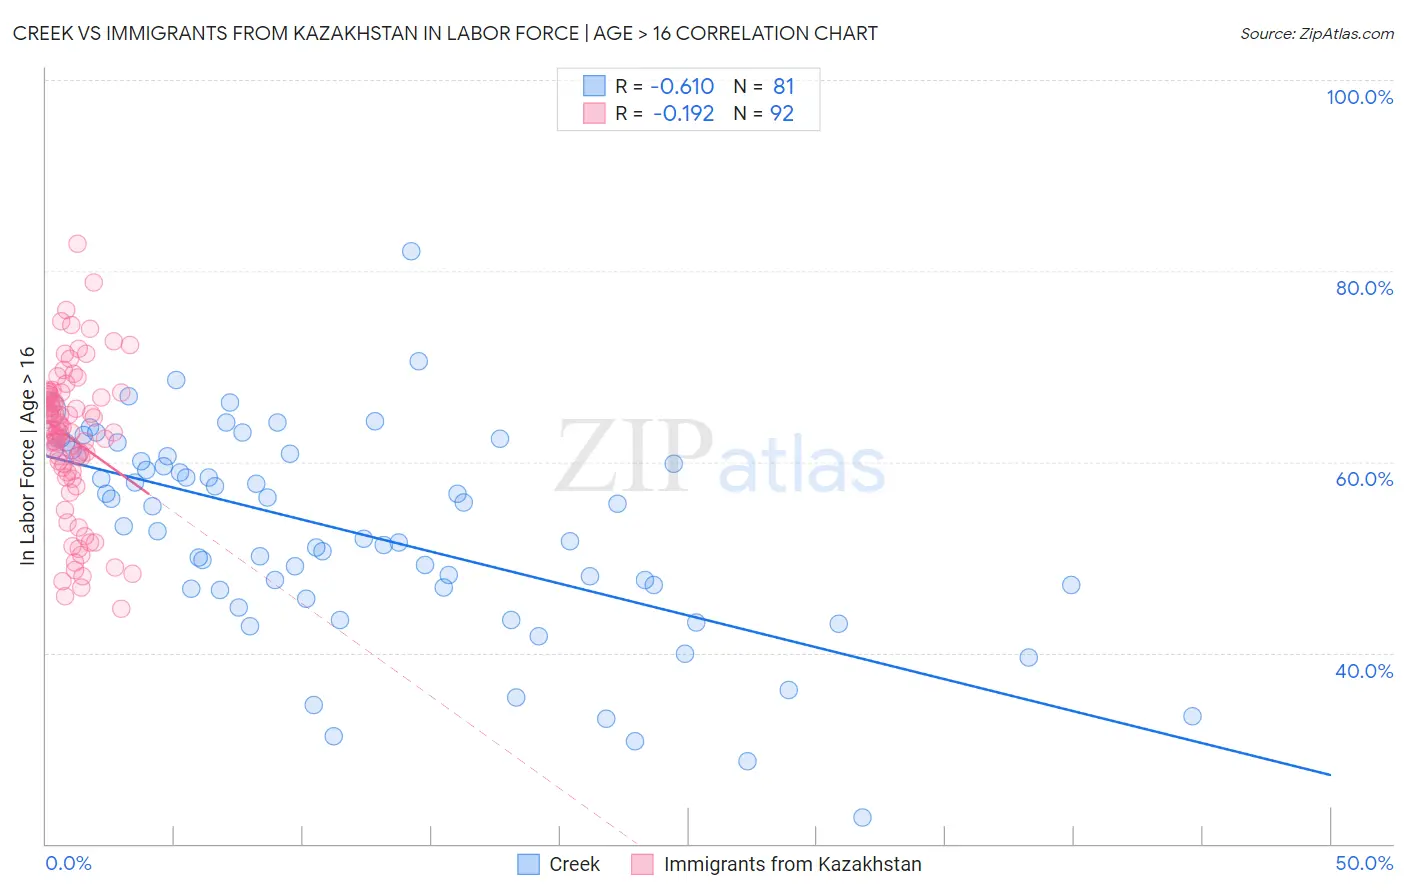
Creek vs Immigrants from Kazakhstan In Labor Force | Age > 16 Correlation Chart
The statistical analysis conducted on geographies consisting of 178,467,646 people shows a significant negative correlation between the proportion of Creek and labor force participation rate among population ages 16 and over in the United States with a correlation coefficient (R) of -0.610 and weighted average of 61.3%. Similarly, the statistical analysis conducted on geographies consisting of 124,444,172 people shows a poor negative correlation between the proportion of Immigrants from Kazakhstan and labor force participation rate among population ages 16 and over in the United States with a correlation coefficient (R) of -0.192 and weighted average of 65.3%, a difference of 6.4%.
In Labor Force | Age > 16 Correlation Summary
| Measurement | Creek | Immigrants from Kazakhstan |
| Minimum | 22.8% | 44.6% |
| Maximum | 82.0% | 82.9% |
| Range | 59.2% | 38.3% |
| Mean | 52.6% | 62.4% |
| Median | 53.3% | 63.4% |
| Interquartile 25% (IQ1) | 46.6% | 58.9% |
| Interquartile 75% (IQ3) | 60.7% | 67.1% |
| Interquartile Range (IQR) | 14.0% | 8.1% |
| Standard Deviation (Sample) | 10.9% | 7.8% |
| Standard Deviation (Population) | 10.8% | 7.7% |
Similar Demographics by In Labor Force | Age > 16
Demographics Similar to Creek by In Labor Force | Age > 16
In terms of in labor force | age > 16, the demographic groups most similar to Creek are Choctaw (61.5%, a difference of 0.22%), Dutch West Indian (61.7%, a difference of 0.59%), Ute (60.9%, a difference of 0.71%), Cajun (61.8%, a difference of 0.74%), and Sioux (61.8%, a difference of 0.86%).
| Demographics | Rating | Rank | In Labor Force | Age > 16 |
| Seminole | 0.0 /100 | #323 | Tragic 62.0% |
| Cheyenne | 0.0 /100 | #324 | Tragic 62.0% |
| Cherokee | 0.0 /100 | #325 | Tragic 61.9% |
| Sioux | 0.0 /100 | #326 | Tragic 61.8% |
| Cajuns | 0.0 /100 | #327 | Tragic 61.8% |
| Dutch West Indians | 0.0 /100 | #328 | Tragic 61.7% |
| Choctaw | 0.0 /100 | #329 | Tragic 61.5% |
| Creek | 0.0 /100 | #330 | Tragic 61.3% |
| Ute | 0.0 /100 | #331 | Tragic 60.9% |
| Crow | 0.0 /100 | #332 | Tragic 60.8% |
| Paiute | 0.0 /100 | #333 | Tragic 60.7% |
| Apache | 0.0 /100 | #334 | Tragic 60.7% |
| Natives/Alaskans | 0.0 /100 | #335 | Tragic 60.6% |
| Menominee | 0.0 /100 | #336 | Tragic 60.6% |
| Colville | 0.0 /100 | #337 | Tragic 59.8% |
Demographics Similar to Immigrants from Kazakhstan by In Labor Force | Age > 16
In terms of in labor force | age > 16, the demographic groups most similar to Immigrants from Kazakhstan are Danish (65.3%, a difference of 0.010%), Immigrants from Western Asia (65.3%, a difference of 0.010%), South African (65.3%, a difference of 0.020%), Immigrants from Belarus (65.2%, a difference of 0.030%), and Australian (65.3%, a difference of 0.040%).
| Demographics | Rating | Rank | In Labor Force | Age > 16 |
| Panamanians | 75.2 /100 | #158 | Good 65.3% |
| Immigrants | Syria | 74.6 /100 | #159 | Good 65.3% |
| Immigrants | South Africa | 73.5 /100 | #160 | Good 65.3% |
| Australians | 71.3 /100 | #161 | Good 65.3% |
| Albanians | 70.8 /100 | #162 | Good 65.3% |
| South Africans | 69.8 /100 | #163 | Good 65.3% |
| Danes | 68.8 /100 | #164 | Good 65.3% |
| Immigrants | Kazakhstan | 68.1 /100 | #165 | Good 65.3% |
| Immigrants | Western Asia | 67.3 /100 | #166 | Good 65.3% |
| Immigrants | Belarus | 66.0 /100 | #167 | Good 65.2% |
| Serbians | 63.5 /100 | #168 | Good 65.2% |
| Arabs | 62.4 /100 | #169 | Good 65.2% |
| Immigrants | Israel | 61.7 /100 | #170 | Good 65.2% |
| Israelis | 61.6 /100 | #171 | Good 65.2% |
| Immigrants | Sweden | 61.3 /100 | #172 | Good 65.2% |