Creek vs Immigrants from Philippines 9th Grade
COMPARE
Creek
Immigrants from Philippines
9th Grade
9th Grade Comparison
Creek
Immigrants from Philippines
95.6%
9TH GRADE
98.8/ 100
METRIC RATING
91st/ 347
METRIC RANK
93.7%
9TH GRADE
0.1/ 100
METRIC RATING
277th/ 347
METRIC RANK
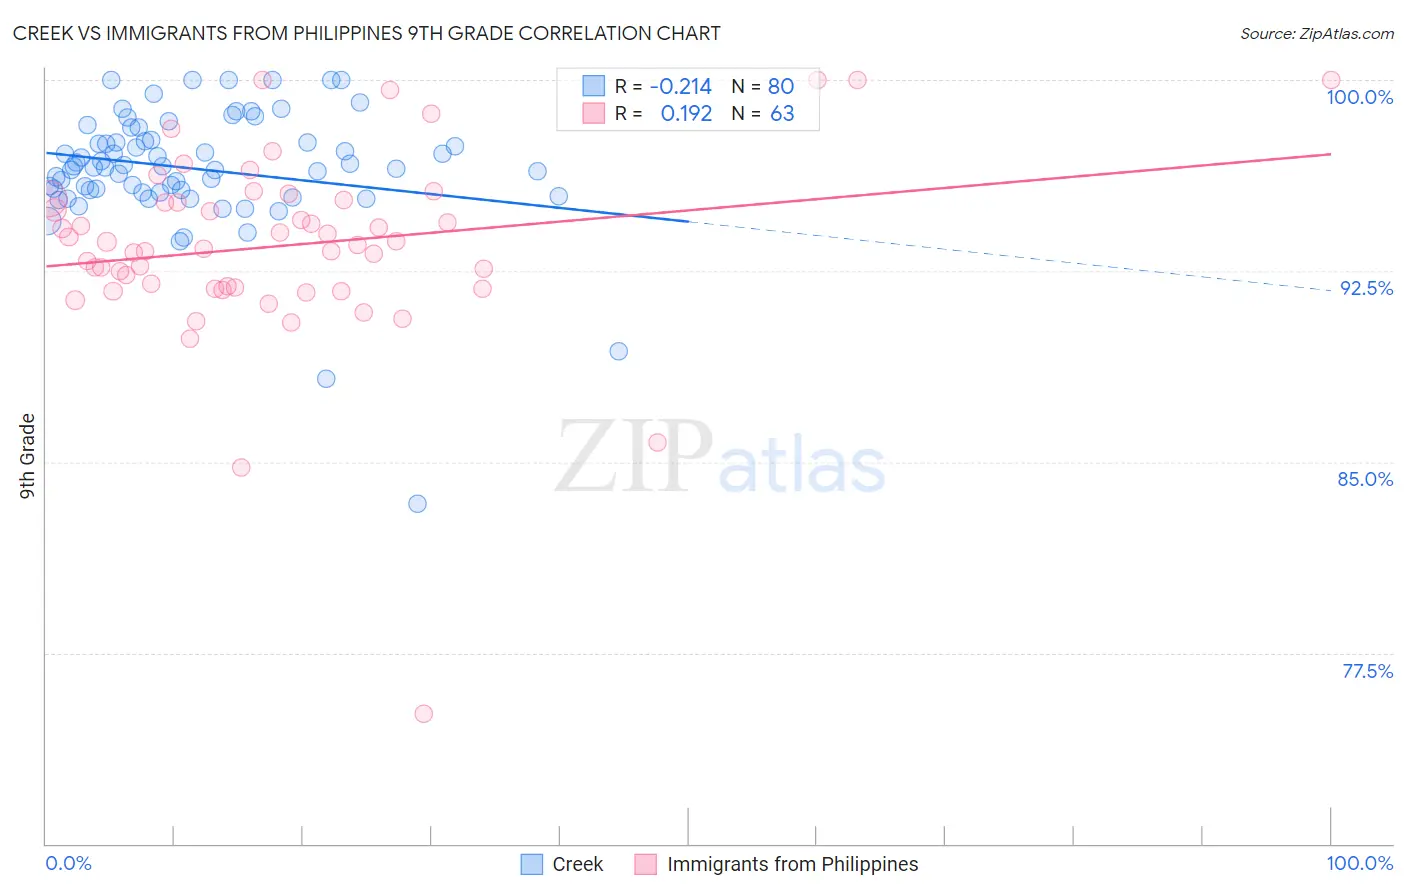
Creek vs Immigrants from Philippines 9th Grade Correlation Chart
The statistical analysis conducted on geographies consisting of 178,480,629 people shows a weak negative correlation between the proportion of Creek and percentage of population with at least 9th grade education in the United States with a correlation coefficient (R) of -0.214 and weighted average of 95.6%. Similarly, the statistical analysis conducted on geographies consisting of 471,300,535 people shows a poor positive correlation between the proportion of Immigrants from Philippines and percentage of population with at least 9th grade education in the United States with a correlation coefficient (R) of 0.192 and weighted average of 93.7%, a difference of 2.0%.
9th Grade Correlation Summary
| Measurement | Creek | Immigrants from Philippines |
| Minimum | 83.3% | 75.1% |
| Maximum | 100.0% | 100.0% |
| Range | 16.7% | 24.9% |
| Mean | 96.5% | 93.5% |
| Median | 96.6% | 93.5% |
| Interquartile 25% (IQ1) | 95.6% | 91.8% |
| Interquartile 75% (IQ3) | 97.6% | 95.3% |
| Interquartile Range (IQR) | 2.0% | 3.5% |
| Standard Deviation (Sample) | 2.5% | 3.8% |
| Standard Deviation (Population) | 2.5% | 3.8% |
Similar Demographics by 9th Grade
Demographics Similar to Creek by 9th Grade
In terms of 9th grade, the demographic groups most similar to Creek are Immigrants from Saudi Arabia (95.6%, a difference of 0.0%), Yugoslavian (95.7%, a difference of 0.010%), South African (95.6%, a difference of 0.010%), Immigrants from Germany (95.6%, a difference of 0.010%), and Immigrants from Latvia (95.6%, a difference of 0.010%).
| Demographics | Rating | Rank | 9th Grade |
| Immigrants | Denmark | 99.1 /100 | #84 | Exceptional 95.7% |
| Icelanders | 99.1 /100 | #85 | Exceptional 95.7% |
| Immigrants | Western Europe | 99.1 /100 | #86 | Exceptional 95.7% |
| Okinawans | 99.0 /100 | #87 | Exceptional 95.7% |
| Immigrants | Czechoslovakia | 98.9 /100 | #88 | Exceptional 95.7% |
| Yugoslavians | 98.9 /100 | #89 | Exceptional 95.7% |
| South Africans | 98.8 /100 | #90 | Exceptional 95.6% |
| Creek | 98.8 /100 | #91 | Exceptional 95.6% |
| Immigrants | Saudi Arabia | 98.8 /100 | #92 | Exceptional 95.6% |
| Immigrants | Germany | 98.7 /100 | #93 | Exceptional 95.6% |
| Immigrants | Latvia | 98.7 /100 | #94 | Exceptional 95.6% |
| Americans | 98.5 /100 | #95 | Exceptional 95.6% |
| Filipinos | 98.5 /100 | #96 | Exceptional 95.6% |
| Delaware | 98.4 /100 | #97 | Exceptional 95.6% |
| Immigrants | Japan | 98.4 /100 | #98 | Exceptional 95.6% |
Demographics Similar to Immigrants from Philippines by 9th Grade
In terms of 9th grade, the demographic groups most similar to Immigrants from Philippines are Immigrants from Eritrea (93.7%, a difference of 0.0%), West Indian (93.7%, a difference of 0.010%), Immigrants from Colombia (93.8%, a difference of 0.020%), Immigrants from South America (93.8%, a difference of 0.030%), and Peruvian (93.8%, a difference of 0.030%).
| Demographics | Rating | Rank | 9th Grade |
| Yuman | 0.2 /100 | #270 | Tragic 93.8% |
| Immigrants | Ghana | 0.2 /100 | #271 | Tragic 93.8% |
| Immigrants | Western Africa | 0.2 /100 | #272 | Tragic 93.8% |
| Immigrants | South America | 0.2 /100 | #273 | Tragic 93.8% |
| Peruvians | 0.2 /100 | #274 | Tragic 93.8% |
| Immigrants | Colombia | 0.2 /100 | #275 | Tragic 93.8% |
| West Indians | 0.2 /100 | #276 | Tragic 93.7% |
| Immigrants | Philippines | 0.1 /100 | #277 | Tragic 93.7% |
| Immigrants | Eritrea | 0.1 /100 | #278 | Tragic 93.7% |
| Trinidadians and Tobagonians | 0.1 /100 | #279 | Tragic 93.7% |
| Taiwanese | 0.1 /100 | #280 | Tragic 93.6% |
| Immigrants | Trinidad and Tobago | 0.1 /100 | #281 | Tragic 93.6% |
| Malaysians | 0.0 /100 | #282 | Tragic 93.5% |
| Barbadians | 0.0 /100 | #283 | Tragic 93.5% |
| Bangladeshis | 0.0 /100 | #284 | Tragic 93.4% |