Creek vs Cuban In Labor Force | Age > 16
COMPARE
Creek
Cuban
In Labor Force | Age > 16
In Labor Force | Age > 16 Comparison
Creek
Cubans
61.3%
IN LABOR FORCE | AGE > 16
0.0/ 100
METRIC RATING
330th/ 347
METRIC RANK
64.2%
IN LABOR FORCE | AGE > 16
0.5/ 100
METRIC RATING
265th/ 347
METRIC RANK
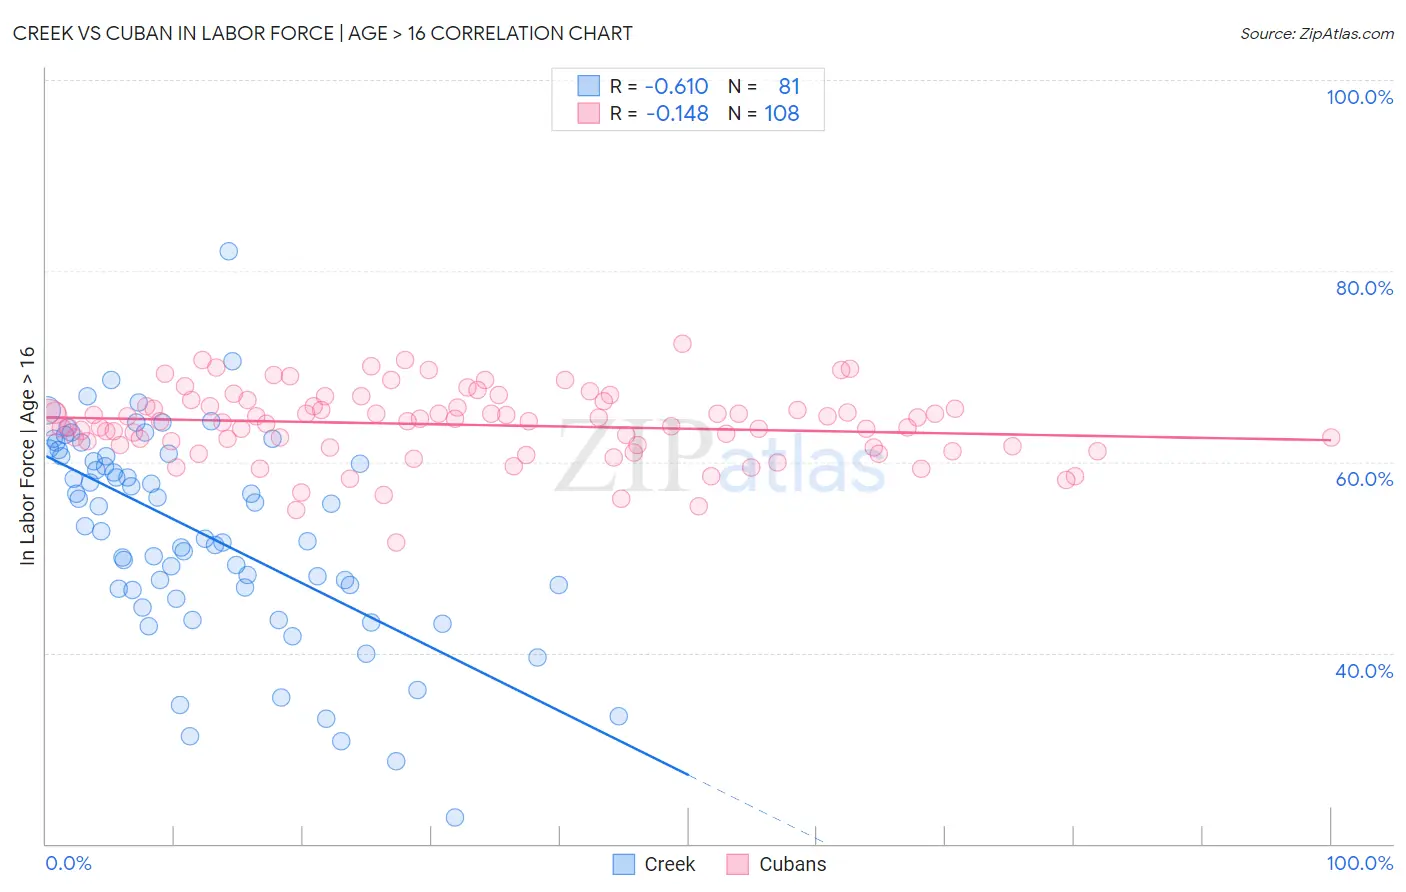
Creek vs Cuban In Labor Force | Age > 16 Correlation Chart
The statistical analysis conducted on geographies consisting of 178,467,646 people shows a significant negative correlation between the proportion of Creek and labor force participation rate among population ages 16 and over in the United States with a correlation coefficient (R) of -0.610 and weighted average of 61.3%. Similarly, the statistical analysis conducted on geographies consisting of 449,375,303 people shows a poor negative correlation between the proportion of Cubans and labor force participation rate among population ages 16 and over in the United States with a correlation coefficient (R) of -0.148 and weighted average of 64.2%, a difference of 4.6%.
In Labor Force | Age > 16 Correlation Summary
| Measurement | Creek | Cuban |
| Minimum | 22.8% | 51.6% |
| Maximum | 82.0% | 72.4% |
| Range | 59.2% | 20.8% |
| Mean | 52.6% | 63.9% |
| Median | 53.3% | 64.3% |
| Interquartile 25% (IQ1) | 46.6% | 61.7% |
| Interquartile 75% (IQ3) | 60.7% | 65.9% |
| Interquartile Range (IQR) | 14.0% | 4.2% |
| Standard Deviation (Sample) | 10.9% | 3.7% |
| Standard Deviation (Population) | 10.8% | 3.7% |
Similar Demographics by In Labor Force | Age > 16
Demographics Similar to Creek by In Labor Force | Age > 16
In terms of in labor force | age > 16, the demographic groups most similar to Creek are Choctaw (61.5%, a difference of 0.22%), Dutch West Indian (61.7%, a difference of 0.59%), Ute (60.9%, a difference of 0.71%), Cajun (61.8%, a difference of 0.74%), and Sioux (61.8%, a difference of 0.86%).
| Demographics | Rating | Rank | In Labor Force | Age > 16 |
| Seminole | 0.0 /100 | #323 | Tragic 62.0% |
| Cheyenne | 0.0 /100 | #324 | Tragic 62.0% |
| Cherokee | 0.0 /100 | #325 | Tragic 61.9% |
| Sioux | 0.0 /100 | #326 | Tragic 61.8% |
| Cajuns | 0.0 /100 | #327 | Tragic 61.8% |
| Dutch West Indians | 0.0 /100 | #328 | Tragic 61.7% |
| Choctaw | 0.0 /100 | #329 | Tragic 61.5% |
| Creek | 0.0 /100 | #330 | Tragic 61.3% |
| Ute | 0.0 /100 | #331 | Tragic 60.9% |
| Crow | 0.0 /100 | #332 | Tragic 60.8% |
| Paiute | 0.0 /100 | #333 | Tragic 60.7% |
| Apache | 0.0 /100 | #334 | Tragic 60.7% |
| Natives/Alaskans | 0.0 /100 | #335 | Tragic 60.6% |
| Menominee | 0.0 /100 | #336 | Tragic 60.6% |
| Colville | 0.0 /100 | #337 | Tragic 59.8% |
Demographics Similar to Cubans by In Labor Force | Age > 16
In terms of in labor force | age > 16, the demographic groups most similar to Cubans are Immigrants from England (64.2%, a difference of 0.010%), Canadian (64.1%, a difference of 0.020%), Spaniard (64.1%, a difference of 0.020%), Dutch (64.2%, a difference of 0.040%), and Bahamian (64.2%, a difference of 0.060%).
| Demographics | Rating | Rank | In Labor Force | Age > 16 |
| Immigrants | Scotland | 0.8 /100 | #258 | Tragic 64.2% |
| Immigrants | Western Europe | 0.7 /100 | #259 | Tragic 64.2% |
| Marshallese | 0.7 /100 | #260 | Tragic 64.2% |
| Basques | 0.7 /100 | #261 | Tragic 64.2% |
| Finns | 0.7 /100 | #262 | Tragic 64.2% |
| Bahamians | 0.6 /100 | #263 | Tragic 64.2% |
| Dutch | 0.6 /100 | #264 | Tragic 64.2% |
| Cubans | 0.5 /100 | #265 | Tragic 64.2% |
| Immigrants | England | 0.5 /100 | #266 | Tragic 64.2% |
| Canadians | 0.5 /100 | #267 | Tragic 64.1% |
| Spaniards | 0.5 /100 | #268 | Tragic 64.1% |
| Irish | 0.4 /100 | #269 | Tragic 64.1% |
| Guyanese | 0.4 /100 | #270 | Tragic 64.1% |
| Dominicans | 0.4 /100 | #271 | Tragic 64.1% |
| Native Hawaiians | 0.3 /100 | #272 | Tragic 64.1% |