Pakistani vs Immigrants from Latvia In Labor Force | Age 25-29
COMPARE
Pakistani
Immigrants from Latvia
In Labor Force | Age 25-29
In Labor Force | Age 25-29 Comparison
Pakistanis
Immigrants from Latvia
84.8%
IN LABOR FORCE | AGE 25-29
70.0/ 100
METRIC RATING
142nd/ 347
METRIC RANK
85.6%
IN LABOR FORCE | AGE 25-29
99.8/ 100
METRIC RATING
51st/ 347
METRIC RANK
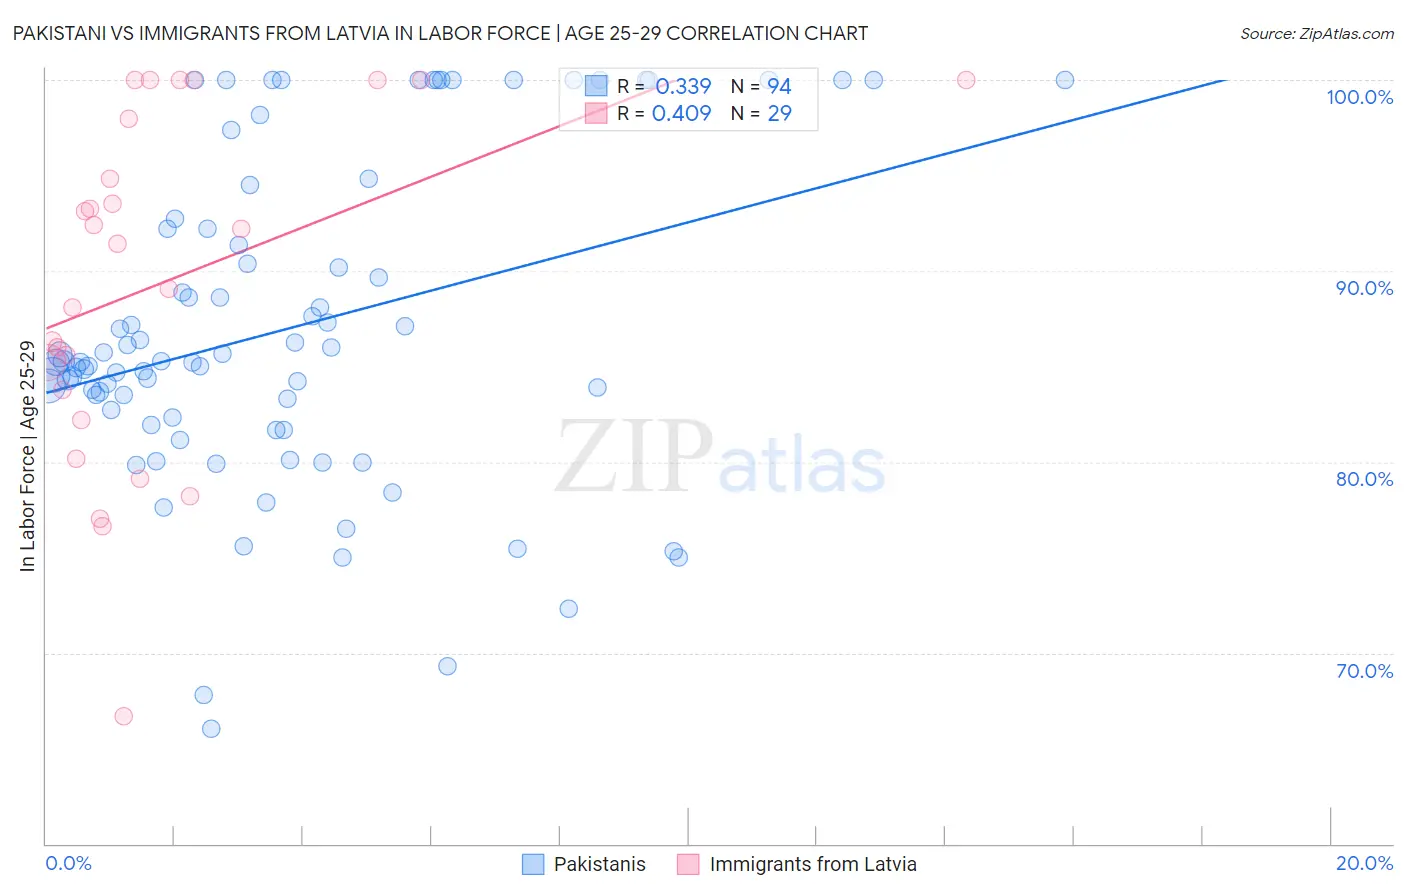
Pakistani vs Immigrants from Latvia In Labor Force | Age 25-29 Correlation Chart
The statistical analysis conducted on geographies consisting of 335,283,437 people shows a mild positive correlation between the proportion of Pakistanis and labor force participation rate among population between the ages 25 and 29 in the United States with a correlation coefficient (R) of 0.339 and weighted average of 84.8%. Similarly, the statistical analysis conducted on geographies consisting of 113,730,924 people shows a moderate positive correlation between the proportion of Immigrants from Latvia and labor force participation rate among population between the ages 25 and 29 in the United States with a correlation coefficient (R) of 0.409 and weighted average of 85.6%, a difference of 0.95%.
In Labor Force | Age 25-29 Correlation Summary
| Measurement | Pakistani | Immigrants from Latvia |
| Minimum | 66.0% | 66.7% |
| Maximum | 100.0% | 100.0% |
| Range | 34.0% | 33.3% |
| Mean | 87.0% | 89.4% |
| Median | 85.2% | 91.5% |
| Interquartile 25% (IQ1) | 82.3% | 83.0% |
| Interquartile 75% (IQ3) | 92.2% | 99.0% |
| Interquartile Range (IQR) | 9.9% | 16.0% |
| Standard Deviation (Sample) | 8.4% | 9.0% |
| Standard Deviation (Population) | 8.3% | 8.8% |
Similar Demographics by In Labor Force | Age 25-29
Demographics Similar to Pakistanis by In Labor Force | Age 25-29
In terms of in labor force | age 25-29, the demographic groups most similar to Pakistanis are Sri Lankan (84.8%, a difference of 0.010%), Immigrants from Laos (84.8%, a difference of 0.010%), Immigrants from Senegal (84.8%, a difference of 0.010%), Armenian (84.8%, a difference of 0.020%), and Immigrants from Eastern Asia (84.8%, a difference of 0.020%).
| Demographics | Rating | Rank | In Labor Force | Age 25-29 |
| Immigrants | Hungary | 76.4 /100 | #135 | Good 84.8% |
| Bhutanese | 76.0 /100 | #136 | Good 84.8% |
| Immigrants | Canada | 73.5 /100 | #137 | Good 84.8% |
| Armenians | 72.7 /100 | #138 | Good 84.8% |
| Immigrants | Eastern Asia | 72.6 /100 | #139 | Good 84.8% |
| Immigrants | North America | 72.1 /100 | #140 | Good 84.8% |
| Danes | 71.9 /100 | #141 | Good 84.8% |
| Pakistanis | 70.0 /100 | #142 | Good 84.8% |
| Sri Lankans | 69.2 /100 | #143 | Good 84.8% |
| Immigrants | Laos | 69.0 /100 | #144 | Good 84.8% |
| Immigrants | Senegal | 68.3 /100 | #145 | Good 84.8% |
| Icelanders | 68.2 /100 | #146 | Good 84.8% |
| Immigrants | Asia | 68.2 /100 | #147 | Good 84.8% |
| Immigrants | England | 65.2 /100 | #148 | Good 84.7% |
| Peruvians | 64.7 /100 | #149 | Good 84.7% |
Demographics Similar to Immigrants from Latvia by In Labor Force | Age 25-29
In terms of in labor force | age 25-29, the demographic groups most similar to Immigrants from Latvia are Yugoslavian (85.6%, a difference of 0.0%), Immigrants from Poland (85.6%, a difference of 0.020%), Swedish (85.6%, a difference of 0.030%), Italian (85.6%, a difference of 0.040%), and Turkish (85.6%, a difference of 0.050%).
| Demographics | Rating | Rank | In Labor Force | Age 25-29 |
| Macedonians | 99.9 /100 | #44 | Exceptional 85.7% |
| Immigrants | Sierra Leone | 99.9 /100 | #45 | Exceptional 85.7% |
| Czechs | 99.8 /100 | #46 | Exceptional 85.6% |
| Turks | 99.8 /100 | #47 | Exceptional 85.6% |
| Italians | 99.8 /100 | #48 | Exceptional 85.6% |
| Swedes | 99.8 /100 | #49 | Exceptional 85.6% |
| Yugoslavians | 99.8 /100 | #50 | Exceptional 85.6% |
| Immigrants | Latvia | 99.8 /100 | #51 | Exceptional 85.6% |
| Immigrants | Poland | 99.7 /100 | #52 | Exceptional 85.6% |
| Belgians | 99.7 /100 | #53 | Exceptional 85.5% |
| Albanians | 99.7 /100 | #54 | Exceptional 85.5% |
| Immigrants | Brazil | 99.7 /100 | #55 | Exceptional 85.5% |
| Eastern Europeans | 99.6 /100 | #56 | Exceptional 85.5% |
| Estonians | 99.6 /100 | #57 | Exceptional 85.5% |
| Greeks | 99.6 /100 | #58 | Exceptional 85.5% |