Creek vs Immigrants from Latvia In Labor Force | Age 25-29
COMPARE
Creek
Immigrants from Latvia
In Labor Force | Age 25-29
In Labor Force | Age 25-29 Comparison
Creek
Immigrants from Latvia
80.7%
IN LABOR FORCE | AGE 25-29
0.0/ 100
METRIC RATING
328th/ 347
METRIC RANK
85.6%
IN LABOR FORCE | AGE 25-29
99.8/ 100
METRIC RATING
51st/ 347
METRIC RANK
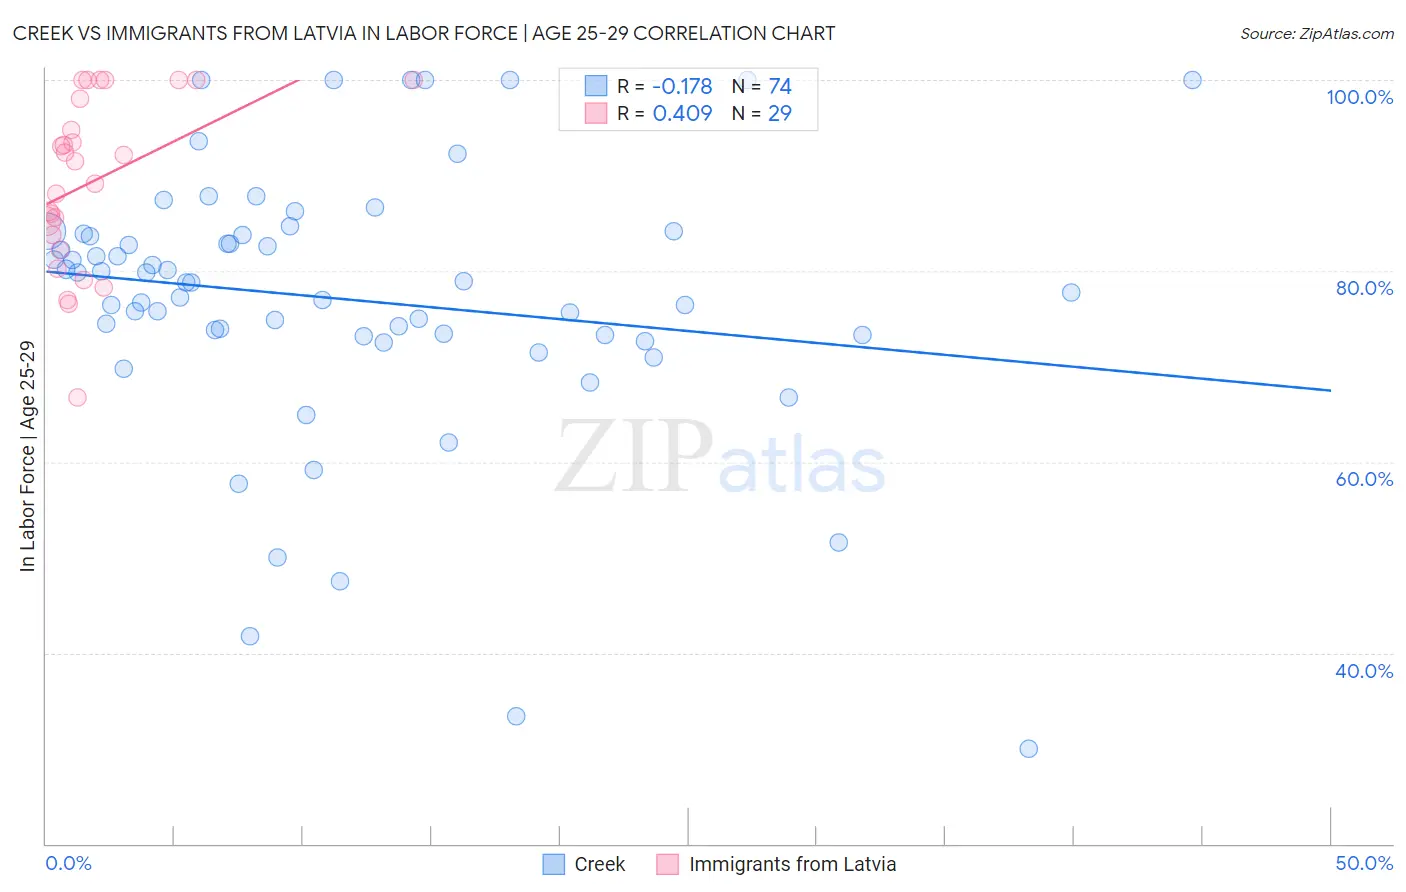
Creek vs Immigrants from Latvia In Labor Force | Age 25-29 Correlation Chart
The statistical analysis conducted on geographies consisting of 178,425,727 people shows a poor negative correlation between the proportion of Creek and labor force participation rate among population between the ages 25 and 29 in the United States with a correlation coefficient (R) of -0.178 and weighted average of 80.7%. Similarly, the statistical analysis conducted on geographies consisting of 113,730,924 people shows a moderate positive correlation between the proportion of Immigrants from Latvia and labor force participation rate among population between the ages 25 and 29 in the United States with a correlation coefficient (R) of 0.409 and weighted average of 85.6%, a difference of 6.1%.
In Labor Force | Age 25-29 Correlation Summary
| Measurement | Creek | Immigrants from Latvia |
| Minimum | 30.0% | 66.7% |
| Maximum | 100.0% | 100.0% |
| Range | 70.0% | 33.3% |
| Mean | 77.0% | 89.4% |
| Median | 78.8% | 91.5% |
| Interquartile 25% (IQ1) | 73.3% | 83.0% |
| Interquartile 75% (IQ3) | 83.8% | 99.0% |
| Interquartile Range (IQR) | 10.5% | 16.0% |
| Standard Deviation (Sample) | 14.1% | 9.0% |
| Standard Deviation (Population) | 14.0% | 8.8% |
Similar Demographics by In Labor Force | Age 25-29
Demographics Similar to Creek by In Labor Force | Age 25-29
In terms of in labor force | age 25-29, the demographic groups most similar to Creek are Yakama (80.6%, a difference of 0.11%), Ute (80.8%, a difference of 0.15%), Puerto Rican (80.4%, a difference of 0.34%), Choctaw (81.0%, a difference of 0.35%), and Cheyenne (80.3%, a difference of 0.48%).
| Demographics | Rating | Rank | In Labor Force | Age 25-29 |
| Shoshone | 0.0 /100 | #321 | Tragic 81.6% |
| Kiowa | 0.0 /100 | #322 | Tragic 81.6% |
| Alaska Natives | 0.0 /100 | #323 | Tragic 81.6% |
| Houma | 0.0 /100 | #324 | Tragic 81.2% |
| Dutch West Indians | 0.0 /100 | #325 | Tragic 81.1% |
| Choctaw | 0.0 /100 | #326 | Tragic 81.0% |
| Ute | 0.0 /100 | #327 | Tragic 80.8% |
| Creek | 0.0 /100 | #328 | Tragic 80.7% |
| Yakama | 0.0 /100 | #329 | Tragic 80.6% |
| Puerto Ricans | 0.0 /100 | #330 | Tragic 80.4% |
| Cheyenne | 0.0 /100 | #331 | Tragic 80.3% |
| Inupiat | 0.0 /100 | #332 | Tragic 79.8% |
| Sioux | 0.0 /100 | #333 | Tragic 79.7% |
| Yuman | 0.0 /100 | #334 | Tragic 79.3% |
| Natives/Alaskans | 0.0 /100 | #335 | Tragic 79.3% |
Demographics Similar to Immigrants from Latvia by In Labor Force | Age 25-29
In terms of in labor force | age 25-29, the demographic groups most similar to Immigrants from Latvia are Yugoslavian (85.6%, a difference of 0.0%), Immigrants from Poland (85.6%, a difference of 0.020%), Swedish (85.6%, a difference of 0.030%), Italian (85.6%, a difference of 0.040%), and Turkish (85.6%, a difference of 0.050%).
| Demographics | Rating | Rank | In Labor Force | Age 25-29 |
| Macedonians | 99.9 /100 | #44 | Exceptional 85.7% |
| Immigrants | Sierra Leone | 99.9 /100 | #45 | Exceptional 85.7% |
| Czechs | 99.8 /100 | #46 | Exceptional 85.6% |
| Turks | 99.8 /100 | #47 | Exceptional 85.6% |
| Italians | 99.8 /100 | #48 | Exceptional 85.6% |
| Swedes | 99.8 /100 | #49 | Exceptional 85.6% |
| Yugoslavians | 99.8 /100 | #50 | Exceptional 85.6% |
| Immigrants | Latvia | 99.8 /100 | #51 | Exceptional 85.6% |
| Immigrants | Poland | 99.7 /100 | #52 | Exceptional 85.6% |
| Belgians | 99.7 /100 | #53 | Exceptional 85.5% |
| Albanians | 99.7 /100 | #54 | Exceptional 85.5% |
| Immigrants | Brazil | 99.7 /100 | #55 | Exceptional 85.5% |
| Eastern Europeans | 99.6 /100 | #56 | Exceptional 85.5% |
| Estonians | 99.6 /100 | #57 | Exceptional 85.5% |
| Greeks | 99.6 /100 | #58 | Exceptional 85.5% |