Cree vs Chinese In Labor Force | Age 25-29
COMPARE
Cree
Chinese
In Labor Force | Age 25-29
In Labor Force | Age 25-29 Comparison
Cree
Chinese
83.8%
IN LABOR FORCE | AGE 25-29
0.3/ 100
METRIC RATING
246th/ 347
METRIC RANK
84.3%
IN LABOR FORCE | AGE 25-29
12.7/ 100
METRIC RATING
210th/ 347
METRIC RANK
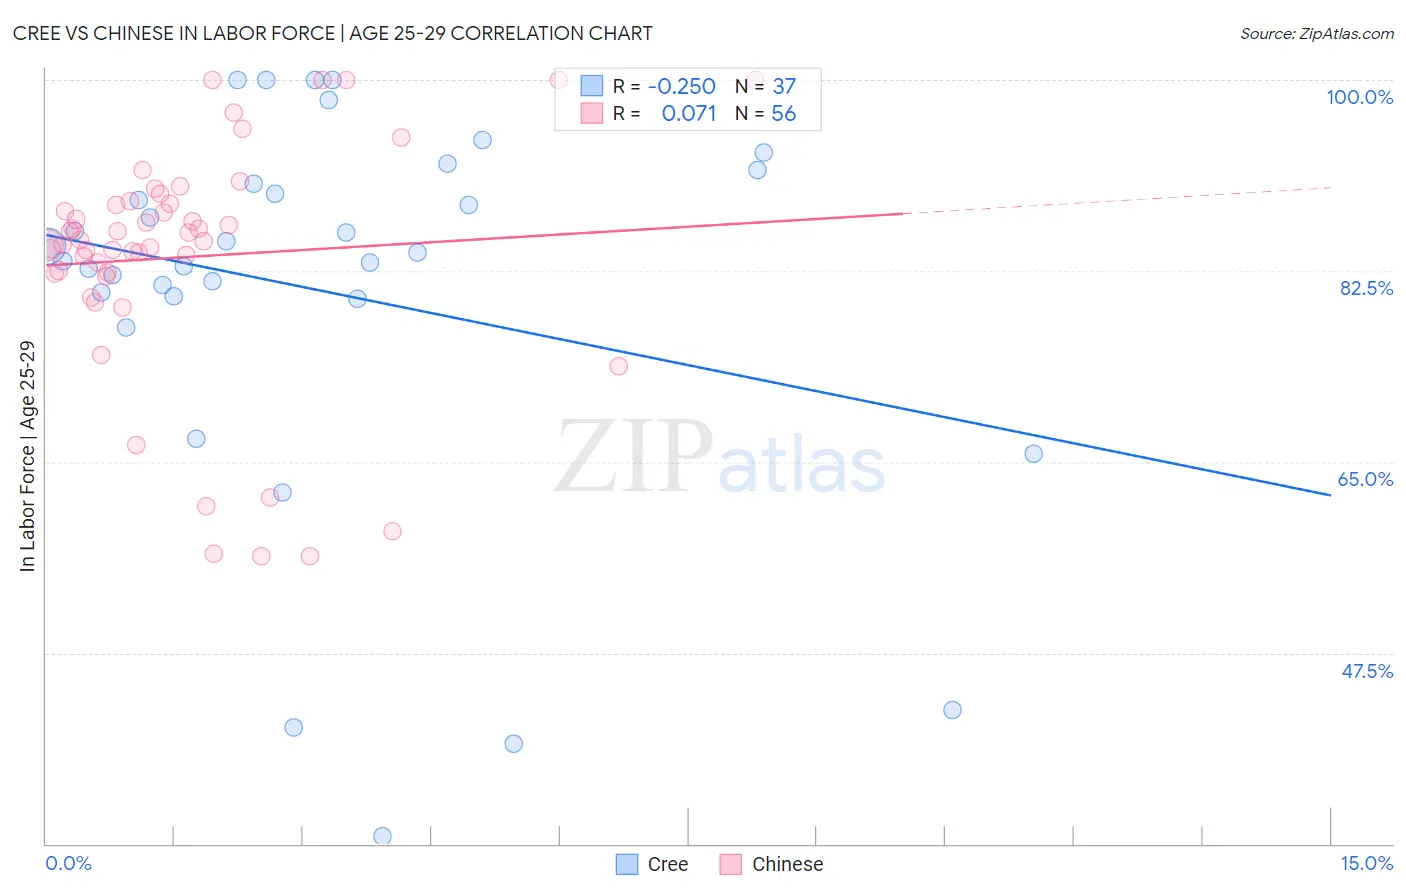
Cree vs Chinese In Labor Force | Age 25-29 Correlation Chart
The statistical analysis conducted on geographies consisting of 76,193,798 people shows a weak negative correlation between the proportion of Cree and labor force participation rate among population between the ages 25 and 29 in the United States with a correlation coefficient (R) of -0.250 and weighted average of 83.8%. Similarly, the statistical analysis conducted on geographies consisting of 64,804,747 people shows a slight positive correlation between the proportion of Chinese and labor force participation rate among population between the ages 25 and 29 in the United States with a correlation coefficient (R) of 0.071 and weighted average of 84.3%, a difference of 0.71%.
In Labor Force | Age 25-29 Correlation Summary
| Measurement | Cree | Chinese |
| Minimum | 30.7% | 56.3% |
| Maximum | 100.0% | 100.0% |
| Range | 69.3% | 43.7% |
| Mean | 80.7% | 83.8% |
| Median | 84.2% | 85.3% |
| Interquartile 25% (IQ1) | 80.1% | 82.3% |
| Interquartile 75% (IQ3) | 91.1% | 88.8% |
| Interquartile Range (IQR) | 11.0% | 6.5% |
| Standard Deviation (Sample) | 17.4% | 10.9% |
| Standard Deviation (Population) | 17.2% | 10.8% |
Similar Demographics by In Labor Force | Age 25-29
Demographics Similar to Cree by In Labor Force | Age 25-29
In terms of in labor force | age 25-29, the demographic groups most similar to Cree are Immigrants from El Salvador (83.7%, a difference of 0.020%), Nonimmigrants (83.7%, a difference of 0.030%), Hmong (83.7%, a difference of 0.040%), Immigrants from Jamaica (83.8%, a difference of 0.050%), and Iroquois (83.8%, a difference of 0.050%).
| Demographics | Rating | Rank | In Labor Force | Age 25-29 |
| Jamaicans | 0.8 /100 | #239 | Tragic 83.9% |
| Trinidadians and Tobagonians | 0.7 /100 | #240 | Tragic 83.9% |
| Alsatians | 0.7 /100 | #241 | Tragic 83.9% |
| U.S. Virgin Islanders | 0.6 /100 | #242 | Tragic 83.8% |
| Salvadorans | 0.5 /100 | #243 | Tragic 83.8% |
| Immigrants | Jamaica | 0.4 /100 | #244 | Tragic 83.8% |
| Iroquois | 0.4 /100 | #245 | Tragic 83.8% |
| Cree | 0.3 /100 | #246 | Tragic 83.8% |
| Immigrants | El Salvador | 0.3 /100 | #247 | Tragic 83.7% |
| Immigrants | Nonimmigrants | 0.3 /100 | #248 | Tragic 83.7% |
| Hmong | 0.3 /100 | #249 | Tragic 83.7% |
| Central Americans | 0.2 /100 | #250 | Tragic 83.7% |
| Bahamians | 0.2 /100 | #251 | Tragic 83.7% |
| Guatemalans | 0.2 /100 | #252 | Tragic 83.7% |
| Immigrants | Trinidad and Tobago | 0.2 /100 | #253 | Tragic 83.7% |
Demographics Similar to Chinese by In Labor Force | Age 25-29
In terms of in labor force | age 25-29, the demographic groups most similar to Chinese are Immigrants from Jordan (84.4%, a difference of 0.0%), Immigrants from Venezuela (84.3%, a difference of 0.0%), Immigrants from Armenia (84.4%, a difference of 0.010%), Immigrants from Indonesia (84.4%, a difference of 0.010%), and Subsaharan African (84.3%, a difference of 0.020%).
| Demographics | Rating | Rank | In Labor Force | Age 25-29 |
| Immigrants | Afghanistan | 15.6 /100 | #203 | Poor 84.4% |
| Venezuelans | 15.1 /100 | #204 | Poor 84.4% |
| Ecuadorians | 14.8 /100 | #205 | Poor 84.4% |
| Immigrants | Cambodia | 14.3 /100 | #206 | Poor 84.4% |
| Immigrants | Armenia | 13.3 /100 | #207 | Poor 84.4% |
| Immigrants | Indonesia | 13.2 /100 | #208 | Poor 84.4% |
| Immigrants | Jordan | 12.8 /100 | #209 | Poor 84.4% |
| Chinese | 12.7 /100 | #210 | Poor 84.3% |
| Immigrants | Venezuela | 12.6 /100 | #211 | Poor 84.3% |
| Sub-Saharan Africans | 11.7 /100 | #212 | Poor 84.3% |
| Japanese | 11.4 /100 | #213 | Poor 84.3% |
| Lebanese | 11.1 /100 | #214 | Poor 84.3% |
| Immigrants | Syria | 10.7 /100 | #215 | Poor 84.3% |
| Israelis | 9.3 /100 | #216 | Tragic 84.3% |
| Immigrants | Ecuador | 9.3 /100 | #217 | Tragic 84.3% |