Cree vs Crow In Labor Force | Age 25-29
COMPARE
Cree
Crow
In Labor Force | Age 25-29
In Labor Force | Age 25-29 Comparison
Cree
Crow
83.8%
IN LABOR FORCE | AGE 25-29
0.3/ 100
METRIC RATING
246th/ 347
METRIC RANK
78.6%
IN LABOR FORCE | AGE 25-29
0.0/ 100
METRIC RATING
337th/ 347
METRIC RANK
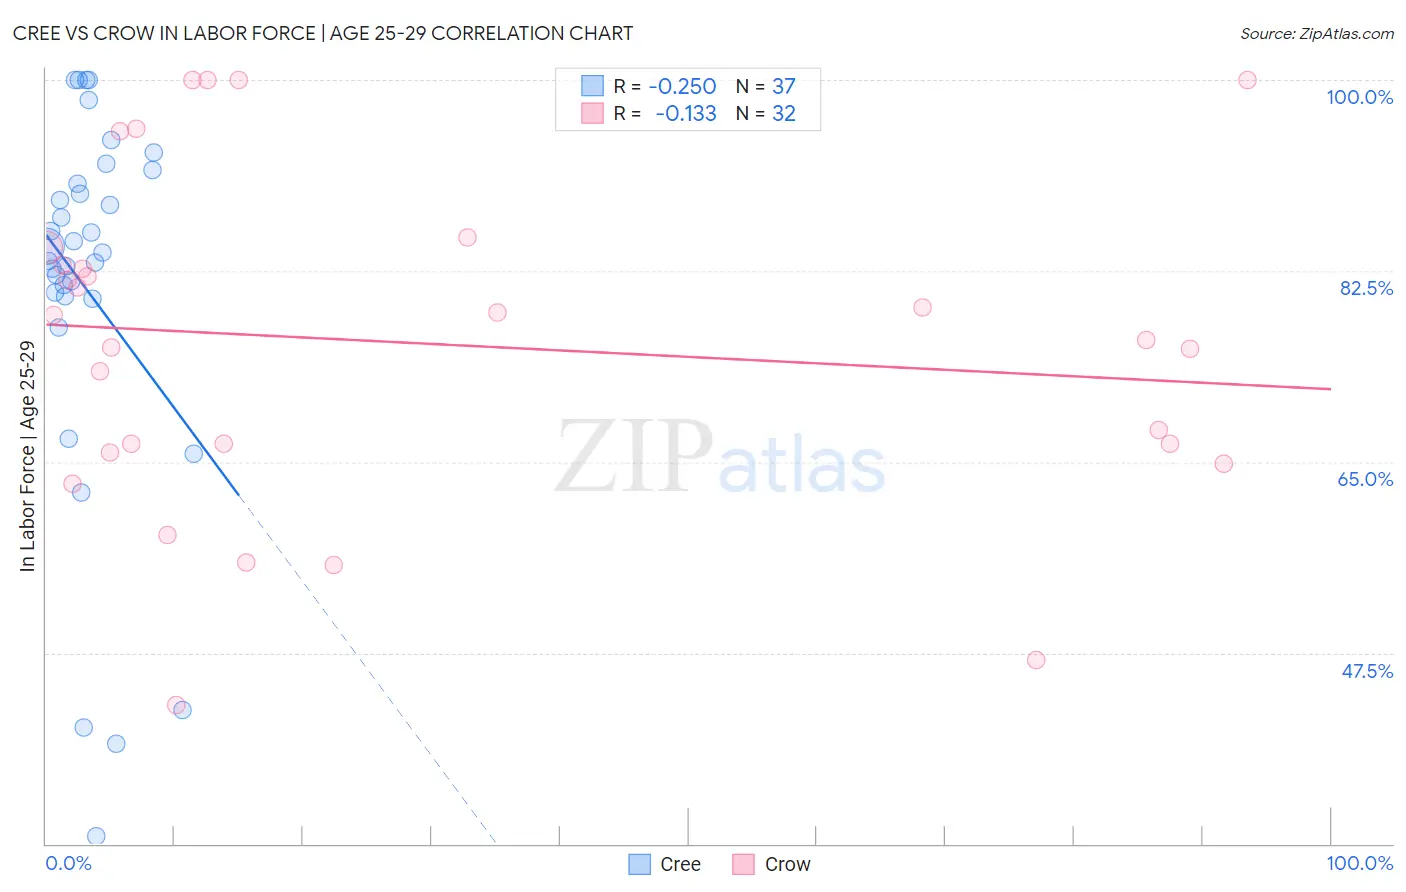
Cree vs Crow In Labor Force | Age 25-29 Correlation Chart
The statistical analysis conducted on geographies consisting of 76,193,798 people shows a weak negative correlation between the proportion of Cree and labor force participation rate among population between the ages 25 and 29 in the United States with a correlation coefficient (R) of -0.250 and weighted average of 83.8%. Similarly, the statistical analysis conducted on geographies consisting of 59,193,680 people shows a poor negative correlation between the proportion of Crow and labor force participation rate among population between the ages 25 and 29 in the United States with a correlation coefficient (R) of -0.133 and weighted average of 78.6%, a difference of 6.5%.
In Labor Force | Age 25-29 Correlation Summary
| Measurement | Cree | Crow |
| Minimum | 30.7% | 42.7% |
| Maximum | 100.0% | 100.0% |
| Range | 69.3% | 57.3% |
| Mean | 80.7% | 75.9% |
| Median | 84.2% | 77.3% |
| Interquartile 25% (IQ1) | 80.1% | 66.2% |
| Interquartile 75% (IQ3) | 91.1% | 83.9% |
| Interquartile Range (IQR) | 11.0% | 17.6% |
| Standard Deviation (Sample) | 17.4% | 15.3% |
| Standard Deviation (Population) | 17.2% | 15.1% |
Similar Demographics by In Labor Force | Age 25-29
Demographics Similar to Cree by In Labor Force | Age 25-29
In terms of in labor force | age 25-29, the demographic groups most similar to Cree are Immigrants from El Salvador (83.7%, a difference of 0.020%), Nonimmigrants (83.7%, a difference of 0.030%), Hmong (83.7%, a difference of 0.040%), Immigrants from Jamaica (83.8%, a difference of 0.050%), and Iroquois (83.8%, a difference of 0.050%).
| Demographics | Rating | Rank | In Labor Force | Age 25-29 |
| Jamaicans | 0.8 /100 | #239 | Tragic 83.9% |
| Trinidadians and Tobagonians | 0.7 /100 | #240 | Tragic 83.9% |
| Alsatians | 0.7 /100 | #241 | Tragic 83.9% |
| U.S. Virgin Islanders | 0.6 /100 | #242 | Tragic 83.8% |
| Salvadorans | 0.5 /100 | #243 | Tragic 83.8% |
| Immigrants | Jamaica | 0.4 /100 | #244 | Tragic 83.8% |
| Iroquois | 0.4 /100 | #245 | Tragic 83.8% |
| Cree | 0.3 /100 | #246 | Tragic 83.8% |
| Immigrants | El Salvador | 0.3 /100 | #247 | Tragic 83.7% |
| Immigrants | Nonimmigrants | 0.3 /100 | #248 | Tragic 83.7% |
| Hmong | 0.3 /100 | #249 | Tragic 83.7% |
| Central Americans | 0.2 /100 | #250 | Tragic 83.7% |
| Bahamians | 0.2 /100 | #251 | Tragic 83.7% |
| Guatemalans | 0.2 /100 | #252 | Tragic 83.7% |
| Immigrants | Trinidad and Tobago | 0.2 /100 | #253 | Tragic 83.7% |
Demographics Similar to Crow by In Labor Force | Age 25-29
In terms of in labor force | age 25-29, the demographic groups most similar to Crow are Lumbee (78.3%, a difference of 0.37%), Immigrants from Yemen (78.2%, a difference of 0.49%), Paiute (78.1%, a difference of 0.65%), Apache (79.2%, a difference of 0.76%), and Native/Alaskan (79.3%, a difference of 0.83%).
| Demographics | Rating | Rank | In Labor Force | Age 25-29 |
| Puerto Ricans | 0.0 /100 | #330 | Tragic 80.4% |
| Cheyenne | 0.0 /100 | #331 | Tragic 80.3% |
| Inupiat | 0.0 /100 | #332 | Tragic 79.8% |
| Sioux | 0.0 /100 | #333 | Tragic 79.7% |
| Yuman | 0.0 /100 | #334 | Tragic 79.3% |
| Natives/Alaskans | 0.0 /100 | #335 | Tragic 79.3% |
| Apache | 0.0 /100 | #336 | Tragic 79.2% |
| Crow | 0.0 /100 | #337 | Tragic 78.6% |
| Lumbee | 0.0 /100 | #338 | Tragic 78.3% |
| Immigrants | Yemen | 0.0 /100 | #339 | Tragic 78.2% |
| Paiute | 0.0 /100 | #340 | Tragic 78.1% |
| Tohono O'odham | 0.0 /100 | #341 | Tragic 77.5% |
| Pueblo | 0.0 /100 | #342 | Tragic 77.5% |
| Arapaho | 0.0 /100 | #343 | Tragic 76.6% |
| Hopi | 0.0 /100 | #344 | Tragic 76.5% |