Cree vs Portuguese In Labor Force | Age 25-29
COMPARE
Cree
Portuguese
In Labor Force | Age 25-29
In Labor Force | Age 25-29 Comparison
Cree
Portuguese
83.8%
IN LABOR FORCE | AGE 25-29
0.3/ 100
METRIC RATING
246th/ 347
METRIC RANK
84.4%
IN LABOR FORCE | AGE 25-29
21.2/ 100
METRIC RATING
194th/ 347
METRIC RANK
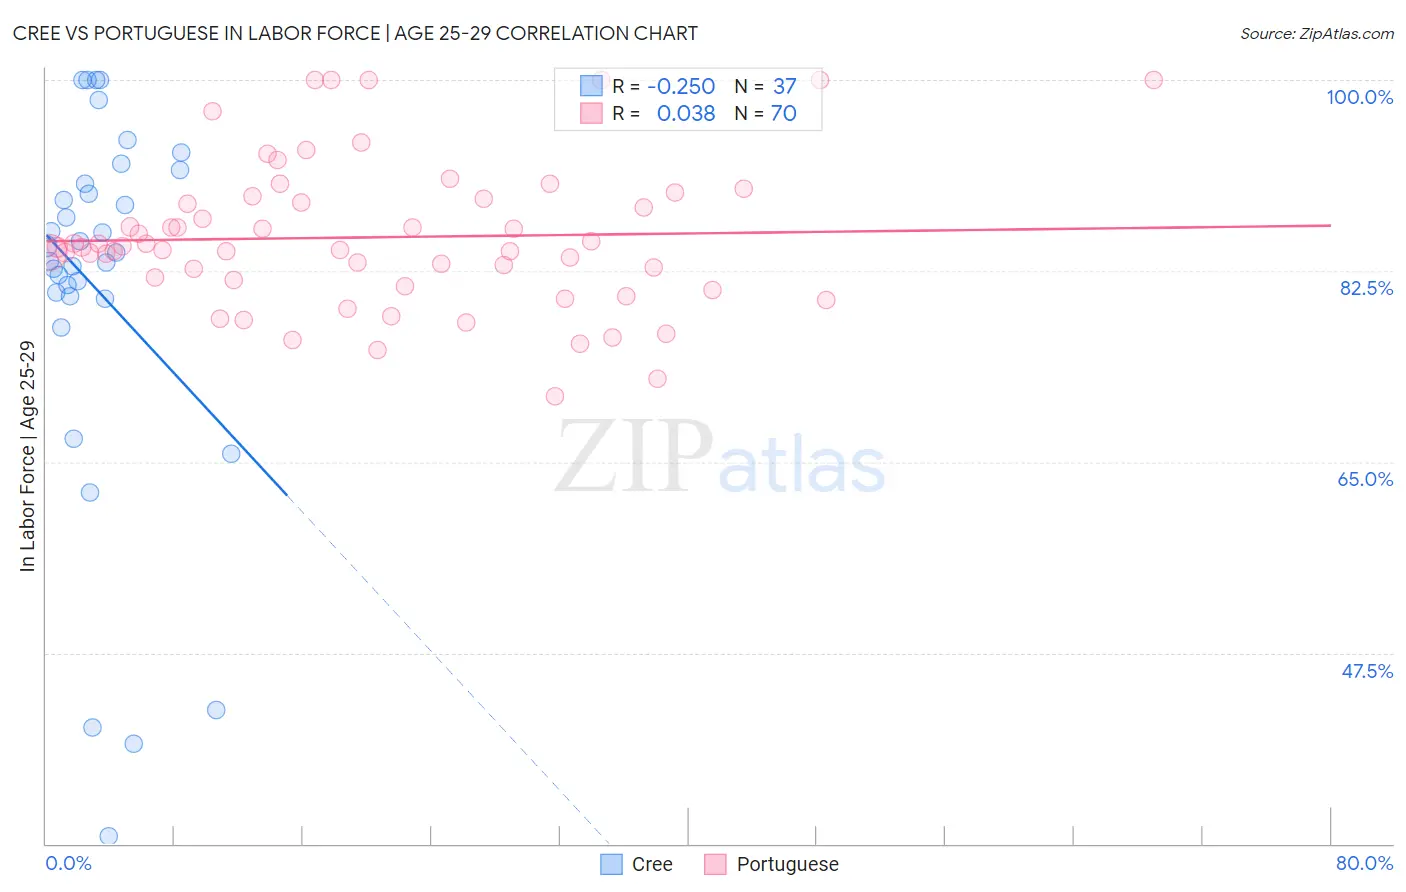
Cree vs Portuguese In Labor Force | Age 25-29 Correlation Chart
The statistical analysis conducted on geographies consisting of 76,193,798 people shows a weak negative correlation between the proportion of Cree and labor force participation rate among population between the ages 25 and 29 in the United States with a correlation coefficient (R) of -0.250 and weighted average of 83.8%. Similarly, the statistical analysis conducted on geographies consisting of 450,025,288 people shows no correlation between the proportion of Portuguese and labor force participation rate among population between the ages 25 and 29 in the United States with a correlation coefficient (R) of 0.038 and weighted average of 84.4%, a difference of 0.83%.
In Labor Force | Age 25-29 Correlation Summary
| Measurement | Cree | Portuguese |
| Minimum | 30.7% | 71.0% |
| Maximum | 100.0% | 100.0% |
| Range | 69.3% | 29.0% |
| Mean | 80.7% | 85.6% |
| Median | 84.2% | 84.7% |
| Interquartile 25% (IQ1) | 80.1% | 81.7% |
| Interquartile 75% (IQ3) | 91.1% | 89.1% |
| Interquartile Range (IQR) | 11.0% | 7.4% |
| Standard Deviation (Sample) | 17.4% | 6.7% |
| Standard Deviation (Population) | 17.2% | 6.7% |
Similar Demographics by In Labor Force | Age 25-29
Demographics Similar to Cree by In Labor Force | Age 25-29
In terms of in labor force | age 25-29, the demographic groups most similar to Cree are Immigrants from El Salvador (83.7%, a difference of 0.020%), Nonimmigrants (83.7%, a difference of 0.030%), Hmong (83.7%, a difference of 0.040%), Immigrants from Jamaica (83.8%, a difference of 0.050%), and Iroquois (83.8%, a difference of 0.050%).
| Demographics | Rating | Rank | In Labor Force | Age 25-29 |
| Jamaicans | 0.8 /100 | #239 | Tragic 83.9% |
| Trinidadians and Tobagonians | 0.7 /100 | #240 | Tragic 83.9% |
| Alsatians | 0.7 /100 | #241 | Tragic 83.9% |
| U.S. Virgin Islanders | 0.6 /100 | #242 | Tragic 83.8% |
| Salvadorans | 0.5 /100 | #243 | Tragic 83.8% |
| Immigrants | Jamaica | 0.4 /100 | #244 | Tragic 83.8% |
| Iroquois | 0.4 /100 | #245 | Tragic 83.8% |
| Cree | 0.3 /100 | #246 | Tragic 83.8% |
| Immigrants | El Salvador | 0.3 /100 | #247 | Tragic 83.7% |
| Immigrants | Nonimmigrants | 0.3 /100 | #248 | Tragic 83.7% |
| Hmong | 0.3 /100 | #249 | Tragic 83.7% |
| Central Americans | 0.2 /100 | #250 | Tragic 83.7% |
| Bahamians | 0.2 /100 | #251 | Tragic 83.7% |
| Guatemalans | 0.2 /100 | #252 | Tragic 83.7% |
| Immigrants | Trinidad and Tobago | 0.2 /100 | #253 | Tragic 83.7% |
Demographics Similar to Portuguese by In Labor Force | Age 25-29
In terms of in labor force | age 25-29, the demographic groups most similar to Portuguese are Immigrants from Israel (84.4%, a difference of 0.010%), Immigrants from South Eastern Asia (84.4%, a difference of 0.020%), Tlingit-Haida (84.4%, a difference of 0.020%), Immigrants from Iraq (84.4%, a difference of 0.030%), and Immigrants from Germany (84.4%, a difference of 0.030%).
| Demographics | Rating | Rank | In Labor Force | Age 25-29 |
| Immigrants | Portugal | 34.7 /100 | #187 | Fair 84.6% |
| Immigrants | Ukraine | 33.7 /100 | #188 | Fair 84.5% |
| Moroccans | 32.6 /100 | #189 | Fair 84.5% |
| Welsh | 31.1 /100 | #190 | Fair 84.5% |
| Zimbabweans | 28.7 /100 | #191 | Fair 84.5% |
| English | 25.8 /100 | #192 | Fair 84.5% |
| South American Indians | 25.0 /100 | #193 | Fair 84.5% |
| Portuguese | 21.2 /100 | #194 | Fair 84.4% |
| Immigrants | Israel | 20.8 /100 | #195 | Fair 84.4% |
| Immigrants | South Eastern Asia | 19.5 /100 | #196 | Poor 84.4% |
| Tlingit-Haida | 19.3 /100 | #197 | Poor 84.4% |
| Immigrants | Iraq | 19.0 /100 | #198 | Poor 84.4% |
| Immigrants | Germany | 18.3 /100 | #199 | Poor 84.4% |
| Immigrants | Kazakhstan | 17.5 /100 | #200 | Poor 84.4% |
| Laotians | 16.6 /100 | #201 | Poor 84.4% |