Cree vs Assyrian/Chaldean/Syriac In Labor Force | Age 25-29
COMPARE
Cree
Assyrian/Chaldean/Syriac
In Labor Force | Age 25-29
In Labor Force | Age 25-29 Comparison
Cree
Assyrians/Chaldeans/Syriacs
83.8%
IN LABOR FORCE | AGE 25-29
0.3/ 100
METRIC RATING
246th/ 347
METRIC RANK
84.7%
IN LABOR FORCE | AGE 25-29
50.2/ 100
METRIC RATING
173rd/ 347
METRIC RANK
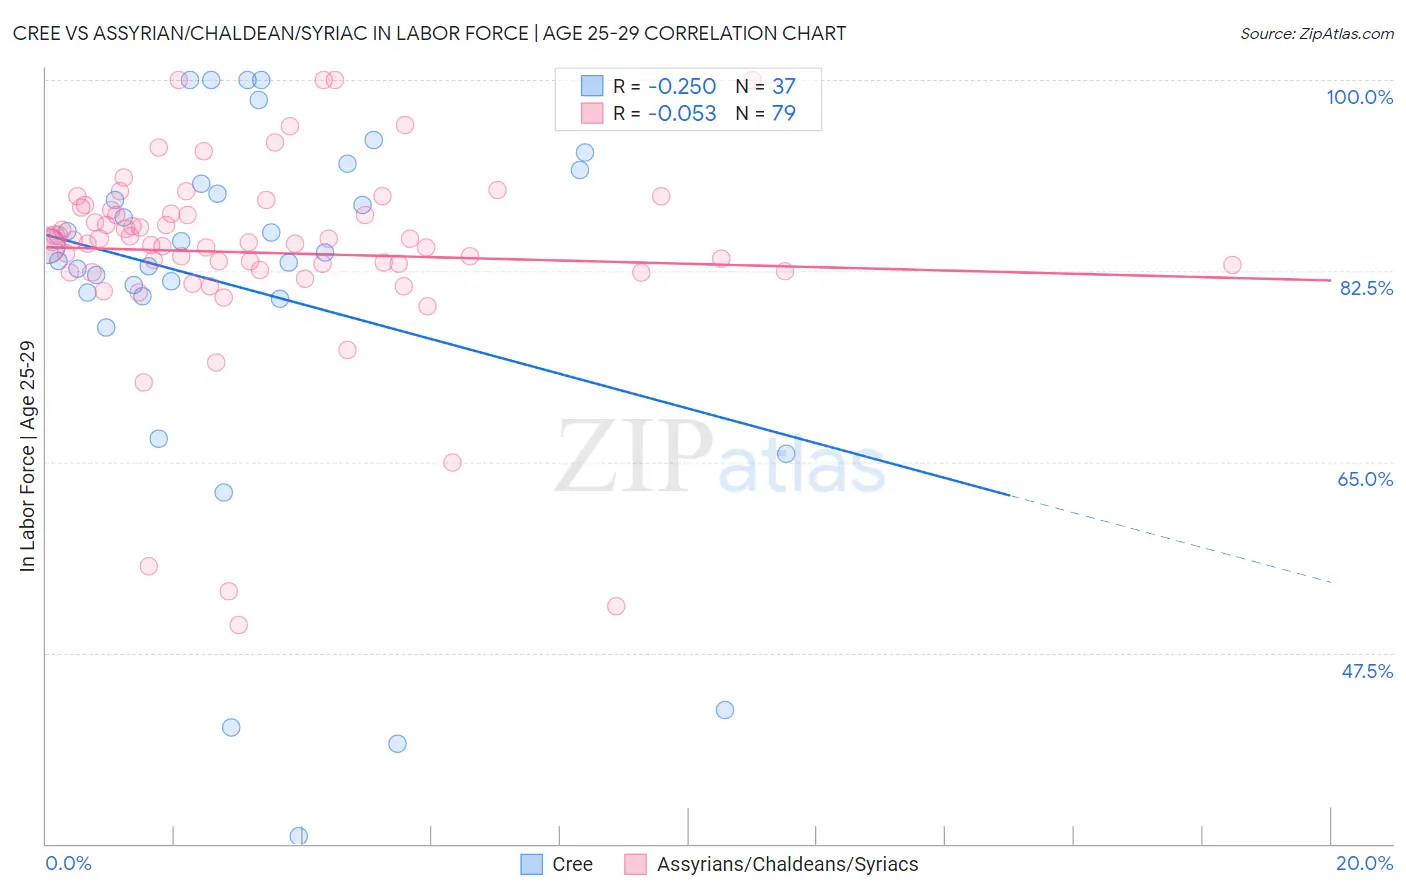
Cree vs Assyrian/Chaldean/Syriac In Labor Force | Age 25-29 Correlation Chart
The statistical analysis conducted on geographies consisting of 76,193,798 people shows a weak negative correlation between the proportion of Cree and labor force participation rate among population between the ages 25 and 29 in the United States with a correlation coefficient (R) of -0.250 and weighted average of 83.8%. Similarly, the statistical analysis conducted on geographies consisting of 110,302,663 people shows a slight negative correlation between the proportion of Assyrians/Chaldeans/Syriacs and labor force participation rate among population between the ages 25 and 29 in the United States with a correlation coefficient (R) of -0.053 and weighted average of 84.7%, a difference of 1.1%.
In Labor Force | Age 25-29 Correlation Summary
| Measurement | Cree | Assyrian/Chaldean/Syriac |
| Minimum | 30.7% | 50.0% |
| Maximum | 100.0% | 100.0% |
| Range | 69.3% | 50.0% |
| Mean | 80.7% | 84.2% |
| Median | 84.2% | 85.1% |
| Interquartile 25% (IQ1) | 80.1% | 82.5% |
| Interquartile 75% (IQ3) | 91.1% | 88.1% |
| Interquartile Range (IQR) | 11.0% | 5.6% |
| Standard Deviation (Sample) | 17.4% | 9.3% |
| Standard Deviation (Population) | 17.2% | 9.3% |
Similar Demographics by In Labor Force | Age 25-29
Demographics Similar to Cree by In Labor Force | Age 25-29
In terms of in labor force | age 25-29, the demographic groups most similar to Cree are Immigrants from El Salvador (83.7%, a difference of 0.020%), Nonimmigrants (83.7%, a difference of 0.030%), Hmong (83.7%, a difference of 0.040%), Immigrants from Jamaica (83.8%, a difference of 0.050%), and Iroquois (83.8%, a difference of 0.050%).
| Demographics | Rating | Rank | In Labor Force | Age 25-29 |
| Jamaicans | 0.8 /100 | #239 | Tragic 83.9% |
| Trinidadians and Tobagonians | 0.7 /100 | #240 | Tragic 83.9% |
| Alsatians | 0.7 /100 | #241 | Tragic 83.9% |
| U.S. Virgin Islanders | 0.6 /100 | #242 | Tragic 83.8% |
| Salvadorans | 0.5 /100 | #243 | Tragic 83.8% |
| Immigrants | Jamaica | 0.4 /100 | #244 | Tragic 83.8% |
| Iroquois | 0.4 /100 | #245 | Tragic 83.8% |
| Cree | 0.3 /100 | #246 | Tragic 83.8% |
| Immigrants | El Salvador | 0.3 /100 | #247 | Tragic 83.7% |
| Immigrants | Nonimmigrants | 0.3 /100 | #248 | Tragic 83.7% |
| Hmong | 0.3 /100 | #249 | Tragic 83.7% |
| Central Americans | 0.2 /100 | #250 | Tragic 83.7% |
| Bahamians | 0.2 /100 | #251 | Tragic 83.7% |
| Guatemalans | 0.2 /100 | #252 | Tragic 83.7% |
| Immigrants | Trinidad and Tobago | 0.2 /100 | #253 | Tragic 83.7% |
Demographics Similar to Assyrians/Chaldeans/Syriacs by In Labor Force | Age 25-29
In terms of in labor force | age 25-29, the demographic groups most similar to Assyrians/Chaldeans/Syriacs are Immigrants from Vietnam (84.7%, a difference of 0.0%), Immigrants from Western Europe (84.7%, a difference of 0.0%), Palestinian (84.7%, a difference of 0.0%), Celtic (84.7%, a difference of 0.020%), and Tongan (84.7%, a difference of 0.020%).
| Demographics | Rating | Rank | In Labor Force | Age 25-29 |
| Immigrants | Spain | 56.9 /100 | #166 | Average 84.7% |
| Indonesians | 56.5 /100 | #167 | Average 84.7% |
| South Americans | 54.9 /100 | #168 | Average 84.7% |
| Celtics | 52.5 /100 | #169 | Average 84.7% |
| Tongans | 52.4 /100 | #170 | Average 84.7% |
| Immigrants | Vietnam | 50.5 /100 | #171 | Average 84.7% |
| Immigrants | Western Europe | 50.4 /100 | #172 | Average 84.7% |
| Assyrians/Chaldeans/Syriacs | 50.2 /100 | #173 | Average 84.7% |
| Palestinians | 50.0 /100 | #174 | Average 84.7% |
| Hungarians | 47.8 /100 | #175 | Average 84.6% |
| Malaysians | 46.8 /100 | #176 | Average 84.6% |
| Immigrants | China | 45.7 /100 | #177 | Average 84.6% |
| Immigrants | Thailand | 45.2 /100 | #178 | Average 84.6% |
| Immigrants | Argentina | 44.0 /100 | #179 | Average 84.6% |
| Immigrants | South America | 42.9 /100 | #180 | Average 84.6% |