Icelander vs Pima In Labor Force | Age > 16
COMPARE
Icelander
Pima
In Labor Force | Age > 16
In Labor Force | Age > 16 Comparison
Icelanders
Pima
65.6%
IN LABOR FORCE | AGE > 16
94.3/ 100
METRIC RATING
131st/ 347
METRIC RANK
57.4%
IN LABOR FORCE | AGE > 16
0.0/ 100
METRIC RATING
344th/ 347
METRIC RANK
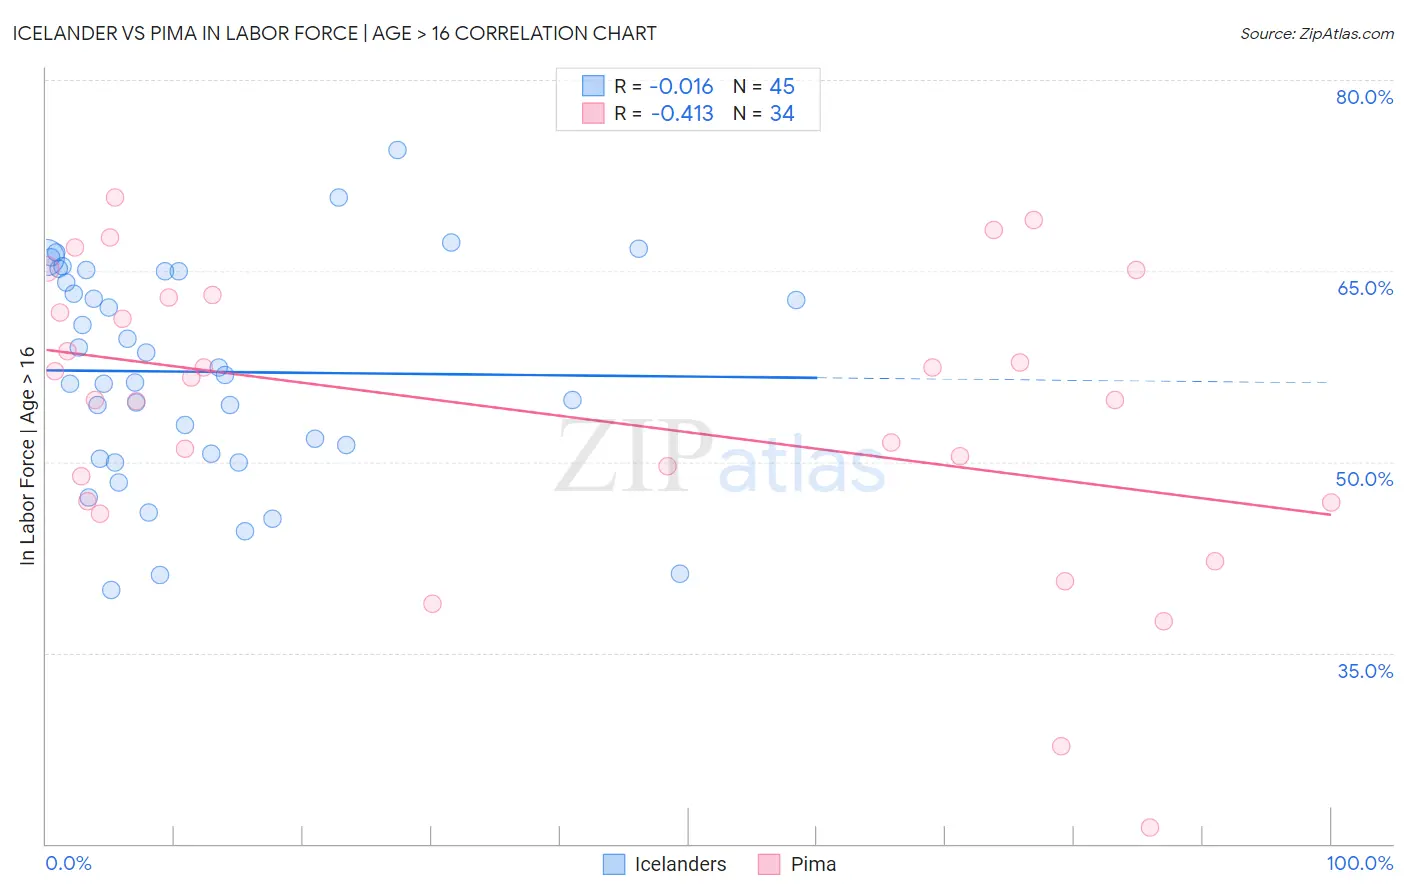
Icelander vs Pima In Labor Force | Age > 16 Correlation Chart
The statistical analysis conducted on geographies consisting of 159,668,800 people shows no correlation between the proportion of Icelanders and labor force participation rate among population ages 16 and over in the United States with a correlation coefficient (R) of -0.016 and weighted average of 65.6%. Similarly, the statistical analysis conducted on geographies consisting of 61,542,645 people shows a moderate negative correlation between the proportion of Pima and labor force participation rate among population ages 16 and over in the United States with a correlation coefficient (R) of -0.413 and weighted average of 57.4%, a difference of 14.3%.
In Labor Force | Age > 16 Correlation Summary
| Measurement | Icelander | Pima |
| Minimum | 39.9% | 21.3% |
| Maximum | 74.5% | 70.8% |
| Range | 34.6% | 49.5% |
| Mean | 57.1% | 53.8% |
| Median | 56.8% | 55.8% |
| Interquartile 25% (IQ1) | 50.4% | 46.9% |
| Interquartile 75% (IQ3) | 65.0% | 62.9% |
| Interquartile Range (IQR) | 14.6% | 16.0% |
| Standard Deviation (Sample) | 8.5% | 11.6% |
| Standard Deviation (Population) | 8.4% | 11.5% |
Similar Demographics by In Labor Force | Age > 16
Demographics Similar to Icelanders by In Labor Force | Age > 16
In terms of in labor force | age > 16, the demographic groups most similar to Icelanders are Immigrants from Guatemala (65.6%, a difference of 0.0%), Immigrants from Philippines (65.6%, a difference of 0.010%), Immigrants from North Macedonia (65.6%, a difference of 0.010%), Ecuadorian (65.6%, a difference of 0.020%), and Immigrants from Eastern Asia (65.7%, a difference of 0.030%).
| Demographics | Rating | Rank | In Labor Force | Age > 16 |
| Iraqis | 95.4 /100 | #124 | Exceptional 65.7% |
| Norwegians | 95.3 /100 | #125 | Exceptional 65.7% |
| Koreans | 95.3 /100 | #126 | Exceptional 65.7% |
| Immigrants | Eastern Asia | 94.9 /100 | #127 | Exceptional 65.7% |
| Ecuadorians | 94.7 /100 | #128 | Exceptional 65.6% |
| Immigrants | Philippines | 94.5 /100 | #129 | Exceptional 65.6% |
| Immigrants | Guatemala | 94.4 /100 | #130 | Exceptional 65.6% |
| Icelanders | 94.3 /100 | #131 | Exceptional 65.6% |
| Immigrants | North Macedonia | 94.1 /100 | #132 | Exceptional 65.6% |
| Immigrants | Lithuania | 93.5 /100 | #133 | Exceptional 65.6% |
| Costa Ricans | 93.2 /100 | #134 | Exceptional 65.6% |
| Guatemalans | 92.5 /100 | #135 | Exceptional 65.6% |
| Immigrants | Argentina | 92.4 /100 | #136 | Exceptional 65.6% |
| Guamanians/Chamorros | 92.4 /100 | #137 | Exceptional 65.6% |
| Immigrants | West Indies | 92.0 /100 | #138 | Exceptional 65.6% |
Demographics Similar to Pima by In Labor Force | Age > 16
In terms of in labor force | age > 16, the demographic groups most similar to Pima are Tohono O'odham (57.2%, a difference of 0.29%), Yuman (57.8%, a difference of 0.70%), Lumbee (56.8%, a difference of 1.1%), Puerto Rican (58.1%, a difference of 1.2%), and Navajo (56.6%, a difference of 1.5%).
| Demographics | Rating | Rank | In Labor Force | Age > 16 |
| Paiute | 0.0 /100 | #333 | Tragic 60.7% |
| Apache | 0.0 /100 | #334 | Tragic 60.7% |
| Natives/Alaskans | 0.0 /100 | #335 | Tragic 60.6% |
| Menominee | 0.0 /100 | #336 | Tragic 60.6% |
| Colville | 0.0 /100 | #337 | Tragic 59.8% |
| Immigrants | Yemen | 0.0 /100 | #338 | Tragic 59.6% |
| Houma | 0.0 /100 | #339 | Tragic 59.5% |
| Pueblo | 0.0 /100 | #340 | Tragic 59.3% |
| Hopi | 0.0 /100 | #341 | Tragic 58.4% |
| Puerto Ricans | 0.0 /100 | #342 | Tragic 58.1% |
| Yuman | 0.0 /100 | #343 | Tragic 57.8% |
| Pima | 0.0 /100 | #344 | Tragic 57.4% |
| Tohono O'odham | 0.0 /100 | #345 | Tragic 57.2% |
| Lumbee | 0.0 /100 | #346 | Tragic 56.8% |
| Navajo | 0.0 /100 | #347 | Tragic 56.6% |