Norwegian vs Danish In Labor Force | Age 25-29
COMPARE
Norwegian
Danish
In Labor Force | Age 25-29
In Labor Force | Age 25-29 Comparison
Norwegians
Danes
86.1%
IN LABOR FORCE | AGE 25-29
100.0/ 100
METRIC RATING
13th/ 347
METRIC RANK
84.8%
IN LABOR FORCE | AGE 25-29
71.9/ 100
METRIC RATING
141st/ 347
METRIC RANK
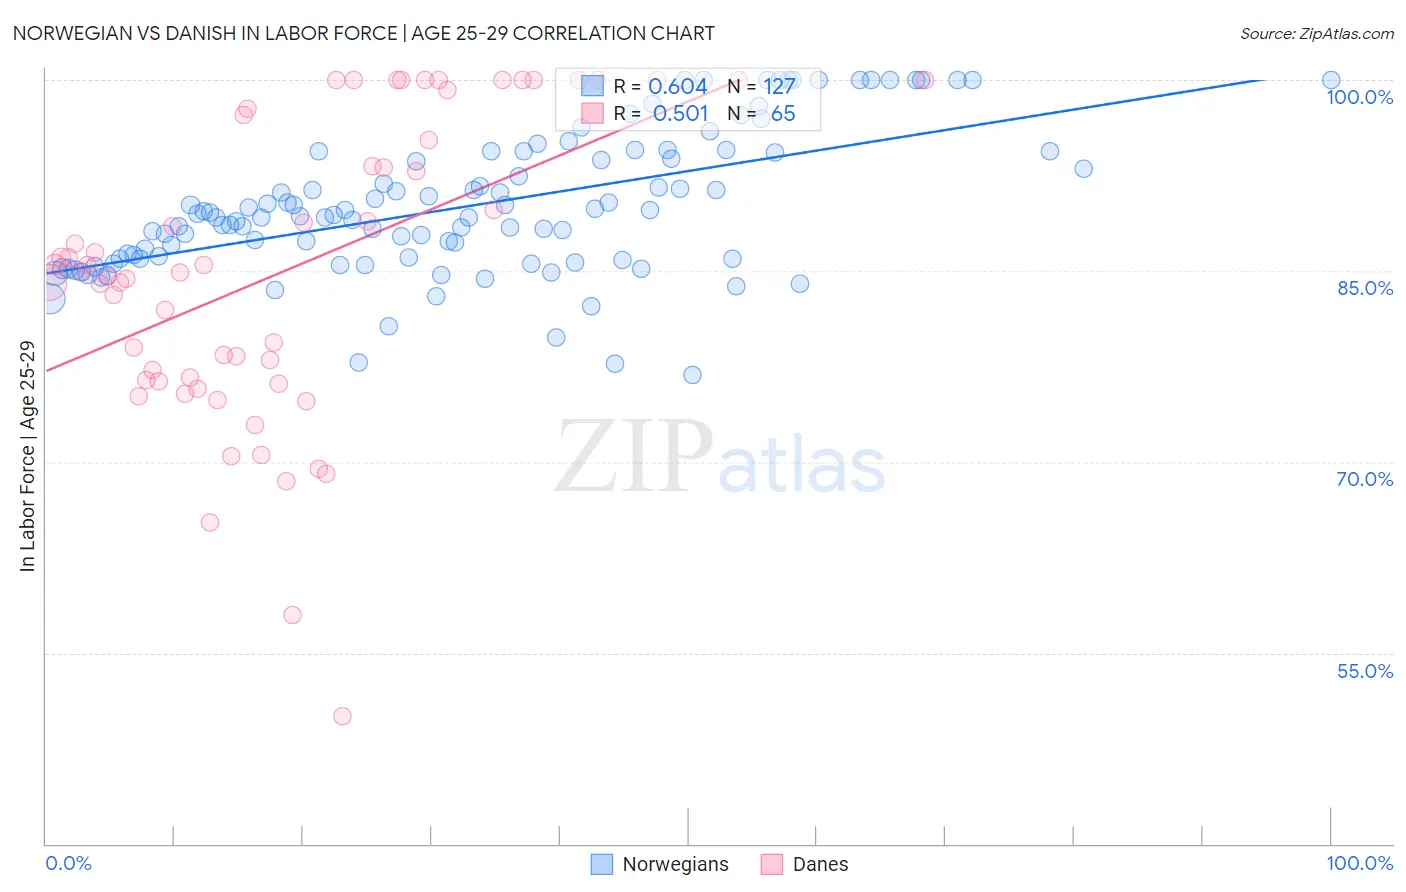
Norwegian vs Danish In Labor Force | Age 25-29 Correlation Chart
The statistical analysis conducted on geographies consisting of 532,549,963 people shows a significant positive correlation between the proportion of Norwegians and labor force participation rate among population between the ages 25 and 29 in the United States with a correlation coefficient (R) of 0.604 and weighted average of 86.1%. Similarly, the statistical analysis conducted on geographies consisting of 473,784,757 people shows a substantial positive correlation between the proportion of Danes and labor force participation rate among population between the ages 25 and 29 in the United States with a correlation coefficient (R) of 0.501 and weighted average of 84.8%, a difference of 1.5%.
In Labor Force | Age 25-29 Correlation Summary
| Measurement | Norwegian | Danish |
| Minimum | 76.8% | 50.0% |
| Maximum | 100.0% | 100.0% |
| Range | 23.2% | 50.0% |
| Mean | 90.1% | 85.1% |
| Median | 89.3% | 85.0% |
| Interquartile 25% (IQ1) | 85.9% | 76.4% |
| Interquartile 75% (IQ3) | 94.3% | 97.5% |
| Interquartile Range (IQR) | 8.4% | 21.1% |
| Standard Deviation (Sample) | 5.5% | 11.7% |
| Standard Deviation (Population) | 5.4% | 11.6% |
Similar Demographics by In Labor Force | Age 25-29
Demographics Similar to Norwegians by In Labor Force | Age 25-29
In terms of in labor force | age 25-29, the demographic groups most similar to Norwegians are Immigrants from Lithuania (86.1%, a difference of 0.010%), Immigrants from Ethiopia (86.1%, a difference of 0.020%), Liberian (86.1%, a difference of 0.030%), Latvian (86.1%, a difference of 0.030%), and Bolivian (86.1%, a difference of 0.030%).
| Demographics | Rating | Rank | In Labor Force | Age 25-29 |
| Slovenes | 100.0 /100 | #6 | Exceptional 86.4% |
| Immigrants | Bosnia and Herzegovina | 100.0 /100 | #7 | Exceptional 86.3% |
| Immigrants | Cabo Verde | 100.0 /100 | #8 | Exceptional 86.2% |
| Ethiopians | 100.0 /100 | #9 | Exceptional 86.2% |
| Liberians | 100.0 /100 | #10 | Exceptional 86.1% |
| Immigrants | Ethiopia | 100.0 /100 | #11 | Exceptional 86.1% |
| Immigrants | Lithuania | 100.0 /100 | #12 | Exceptional 86.1% |
| Norwegians | 100.0 /100 | #13 | Exceptional 86.1% |
| Latvians | 100.0 /100 | #14 | Exceptional 86.1% |
| Bolivians | 100.0 /100 | #15 | Exceptional 86.1% |
| Immigrants | Bolivia | 100.0 /100 | #16 | Exceptional 86.1% |
| Bermudans | 100.0 /100 | #17 | Exceptional 86.0% |
| Bulgarians | 100.0 /100 | #18 | Exceptional 86.0% |
| Cape Verdeans | 100.0 /100 | #19 | Exceptional 86.0% |
| Immigrants | Ireland | 100.0 /100 | #20 | Exceptional 86.0% |
Demographics Similar to Danes by In Labor Force | Age 25-29
In terms of in labor force | age 25-29, the demographic groups most similar to Danes are Immigrants from North America (84.8%, a difference of 0.0%), Armenian (84.8%, a difference of 0.010%), Immigrants from Eastern Asia (84.8%, a difference of 0.010%), Immigrants from Canada (84.8%, a difference of 0.020%), and Pakistani (84.8%, a difference of 0.020%).
| Demographics | Rating | Rank | In Labor Force | Age 25-29 |
| Syrians | 76.5 /100 | #134 | Good 84.8% |
| Immigrants | Hungary | 76.4 /100 | #135 | Good 84.8% |
| Bhutanese | 76.0 /100 | #136 | Good 84.8% |
| Immigrants | Canada | 73.5 /100 | #137 | Good 84.8% |
| Armenians | 72.7 /100 | #138 | Good 84.8% |
| Immigrants | Eastern Asia | 72.6 /100 | #139 | Good 84.8% |
| Immigrants | North America | 72.1 /100 | #140 | Good 84.8% |
| Danes | 71.9 /100 | #141 | Good 84.8% |
| Pakistanis | 70.0 /100 | #142 | Good 84.8% |
| Sri Lankans | 69.2 /100 | #143 | Good 84.8% |
| Immigrants | Laos | 69.0 /100 | #144 | Good 84.8% |
| Immigrants | Senegal | 68.3 /100 | #145 | Good 84.8% |
| Icelanders | 68.2 /100 | #146 | Good 84.8% |
| Immigrants | Asia | 68.2 /100 | #147 | Good 84.8% |
| Immigrants | England | 65.2 /100 | #148 | Good 84.7% |