Sioux vs Danish In Labor Force | Age 25-29
COMPARE
Sioux
Danish
In Labor Force | Age 25-29
In Labor Force | Age 25-29 Comparison
Sioux
Danes
79.7%
IN LABOR FORCE | AGE 25-29
0.0/ 100
METRIC RATING
333rd/ 347
METRIC RANK
84.8%
IN LABOR FORCE | AGE 25-29
71.9/ 100
METRIC RATING
141st/ 347
METRIC RANK
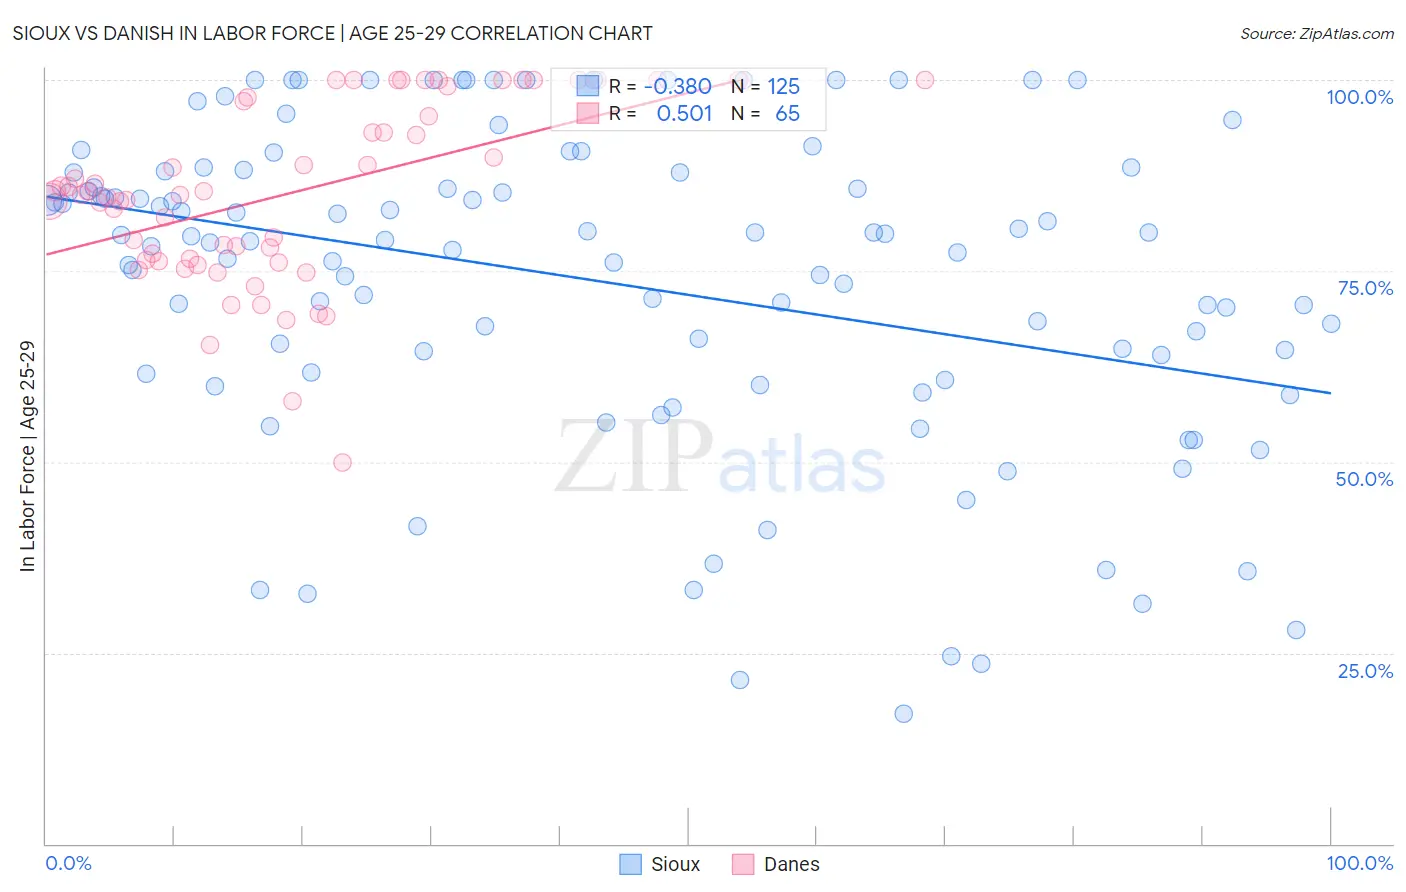
Sioux vs Danish In Labor Force | Age 25-29 Correlation Chart
The statistical analysis conducted on geographies consisting of 234,111,453 people shows a mild negative correlation between the proportion of Sioux and labor force participation rate among population between the ages 25 and 29 in the United States with a correlation coefficient (R) of -0.380 and weighted average of 79.7%. Similarly, the statistical analysis conducted on geographies consisting of 473,784,757 people shows a substantial positive correlation between the proportion of Danes and labor force participation rate among population between the ages 25 and 29 in the United States with a correlation coefficient (R) of 0.501 and weighted average of 84.8%, a difference of 6.4%.
In Labor Force | Age 25-29 Correlation Summary
| Measurement | Sioux | Danish |
| Minimum | 17.0% | 50.0% |
| Maximum | 100.0% | 100.0% |
| Range | 83.0% | 50.0% |
| Mean | 73.7% | 85.1% |
| Median | 78.9% | 85.0% |
| Interquartile 25% (IQ1) | 61.6% | 76.4% |
| Interquartile 75% (IQ3) | 87.9% | 97.5% |
| Interquartile Range (IQR) | 26.3% | 21.1% |
| Standard Deviation (Sample) | 20.5% | 11.7% |
| Standard Deviation (Population) | 20.4% | 11.6% |
Similar Demographics by In Labor Force | Age 25-29
Demographics Similar to Sioux by In Labor Force | Age 25-29
In terms of in labor force | age 25-29, the demographic groups most similar to Sioux are Inupiat (79.8%, a difference of 0.11%), Yuman (79.3%, a difference of 0.42%), Native/Alaskan (79.3%, a difference of 0.50%), Apache (79.2%, a difference of 0.57%), and Cheyenne (80.3%, a difference of 0.80%).
| Demographics | Rating | Rank | In Labor Force | Age 25-29 |
| Choctaw | 0.0 /100 | #326 | Tragic 81.0% |
| Ute | 0.0 /100 | #327 | Tragic 80.8% |
| Creek | 0.0 /100 | #328 | Tragic 80.7% |
| Yakama | 0.0 /100 | #329 | Tragic 80.6% |
| Puerto Ricans | 0.0 /100 | #330 | Tragic 80.4% |
| Cheyenne | 0.0 /100 | #331 | Tragic 80.3% |
| Inupiat | 0.0 /100 | #332 | Tragic 79.8% |
| Sioux | 0.0 /100 | #333 | Tragic 79.7% |
| Yuman | 0.0 /100 | #334 | Tragic 79.3% |
| Natives/Alaskans | 0.0 /100 | #335 | Tragic 79.3% |
| Apache | 0.0 /100 | #336 | Tragic 79.2% |
| Crow | 0.0 /100 | #337 | Tragic 78.6% |
| Lumbee | 0.0 /100 | #338 | Tragic 78.3% |
| Immigrants | Yemen | 0.0 /100 | #339 | Tragic 78.2% |
| Paiute | 0.0 /100 | #340 | Tragic 78.1% |
Demographics Similar to Danes by In Labor Force | Age 25-29
In terms of in labor force | age 25-29, the demographic groups most similar to Danes are Immigrants from North America (84.8%, a difference of 0.0%), Armenian (84.8%, a difference of 0.010%), Immigrants from Eastern Asia (84.8%, a difference of 0.010%), Immigrants from Canada (84.8%, a difference of 0.020%), and Pakistani (84.8%, a difference of 0.020%).
| Demographics | Rating | Rank | In Labor Force | Age 25-29 |
| Syrians | 76.5 /100 | #134 | Good 84.8% |
| Immigrants | Hungary | 76.4 /100 | #135 | Good 84.8% |
| Bhutanese | 76.0 /100 | #136 | Good 84.8% |
| Immigrants | Canada | 73.5 /100 | #137 | Good 84.8% |
| Armenians | 72.7 /100 | #138 | Good 84.8% |
| Immigrants | Eastern Asia | 72.6 /100 | #139 | Good 84.8% |
| Immigrants | North America | 72.1 /100 | #140 | Good 84.8% |
| Danes | 71.9 /100 | #141 | Good 84.8% |
| Pakistanis | 70.0 /100 | #142 | Good 84.8% |
| Sri Lankans | 69.2 /100 | #143 | Good 84.8% |
| Immigrants | Laos | 69.0 /100 | #144 | Good 84.8% |
| Immigrants | Senegal | 68.3 /100 | #145 | Good 84.8% |
| Icelanders | 68.2 /100 | #146 | Good 84.8% |
| Immigrants | Asia | 68.2 /100 | #147 | Good 84.8% |
| Immigrants | England | 65.2 /100 | #148 | Good 84.7% |