Chippewa vs Sudanese In Labor Force | Age 20-64
COMPARE
Chippewa
Sudanese
In Labor Force | Age 20-64
In Labor Force | Age 20-64 Comparison
Chippewa
Sudanese
77.3%
IN LABOR FORCE | AGE 20-64
0.0/ 100
METRIC RATING
303rd/ 347
METRIC RANK
80.8%
IN LABOR FORCE | AGE 20-64
100.0/ 100
METRIC RATING
22nd/ 347
METRIC RANK
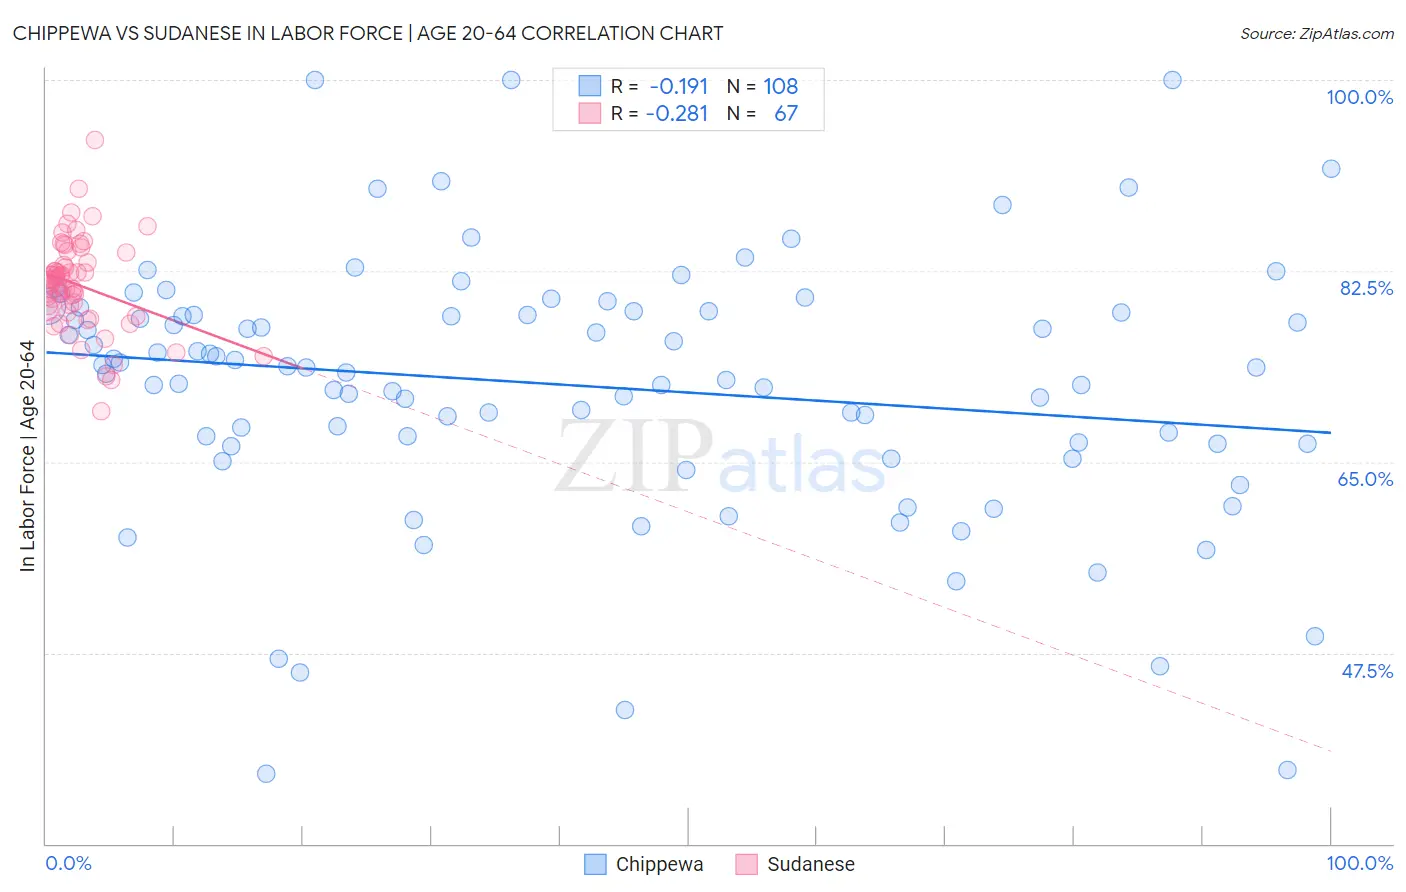
Chippewa vs Sudanese In Labor Force | Age 20-64 Correlation Chart
The statistical analysis conducted on geographies consisting of 215,053,838 people shows a poor negative correlation between the proportion of Chippewa and labor force participation rate among population between the ages 20 and 64 in the United States with a correlation coefficient (R) of -0.191 and weighted average of 77.3%. Similarly, the statistical analysis conducted on geographies consisting of 110,143,017 people shows a weak negative correlation between the proportion of Sudanese and labor force participation rate among population between the ages 20 and 64 in the United States with a correlation coefficient (R) of -0.281 and weighted average of 80.8%, a difference of 4.6%.
In Labor Force | Age 20-64 Correlation Summary
| Measurement | Chippewa | Sudanese |
| Minimum | 36.4% | 69.6% |
| Maximum | 100.0% | 94.5% |
| Range | 63.6% | 24.9% |
| Mean | 72.0% | 81.2% |
| Median | 73.6% | 81.4% |
| Interquartile 25% (IQ1) | 66.7% | 79.1% |
| Interquartile 75% (IQ3) | 78.7% | 83.3% |
| Interquartile Range (IQR) | 12.0% | 4.2% |
| Standard Deviation (Sample) | 11.9% | 4.2% |
| Standard Deviation (Population) | 11.9% | 4.2% |
Similar Demographics by In Labor Force | Age 20-64
Demographics Similar to Chippewa by In Labor Force | Age 20-64
In terms of in labor force | age 20-64, the demographic groups most similar to Chippewa are Immigrants from Mexico (77.3%, a difference of 0.070%), Mexican (77.2%, a difference of 0.11%), Potawatomi (77.2%, a difference of 0.12%), Iroquois (77.5%, a difference of 0.22%), and Nepalese (77.5%, a difference of 0.27%).
| Demographics | Rating | Rank | In Labor Force | Age 20-64 |
| Immigrants | Dominican Republic | 0.0 /100 | #296 | Tragic 77.7% |
| Dominicans | 0.0 /100 | #297 | Tragic 77.7% |
| Cree | 0.0 /100 | #298 | Tragic 77.7% |
| Hispanics or Latinos | 0.0 /100 | #299 | Tragic 77.6% |
| Spanish American Indians | 0.0 /100 | #300 | Tragic 77.6% |
| Nepalese | 0.0 /100 | #301 | Tragic 77.5% |
| Iroquois | 0.0 /100 | #302 | Tragic 77.5% |
| Chippewa | 0.0 /100 | #303 | Tragic 77.3% |
| Immigrants | Mexico | 0.0 /100 | #304 | Tragic 77.3% |
| Mexicans | 0.0 /100 | #305 | Tragic 77.2% |
| Potawatomi | 0.0 /100 | #306 | Tragic 77.2% |
| Central American Indians | 0.0 /100 | #307 | Tragic 77.1% |
| Alaska Natives | 0.0 /100 | #308 | Tragic 77.0% |
| Americans | 0.0 /100 | #309 | Tragic 77.0% |
| Comanche | 0.0 /100 | #310 | Tragic 77.0% |
Demographics Similar to Sudanese by In Labor Force | Age 20-64
In terms of in labor force | age 20-64, the demographic groups most similar to Sudanese are Immigrants from Bosnia and Herzegovina (80.8%, a difference of 0.0%), Immigrants from Morocco (80.8%, a difference of 0.020%), Kenyan (80.8%, a difference of 0.030%), Immigrants from Serbia (80.8%, a difference of 0.050%), and Liberian (80.9%, a difference of 0.070%).
| Demographics | Rating | Rank | In Labor Force | Age 20-64 |
| Bulgarians | 100.0 /100 | #15 | Exceptional 81.1% |
| Immigrants | Nepal | 100.0 /100 | #16 | Exceptional 81.1% |
| Norwegians | 100.0 /100 | #17 | Exceptional 81.0% |
| Immigrants | Bulgaria | 100.0 /100 | #18 | Exceptional 81.0% |
| Zimbabweans | 100.0 /100 | #19 | Exceptional 81.0% |
| Thais | 100.0 /100 | #20 | Exceptional 80.9% |
| Liberians | 100.0 /100 | #21 | Exceptional 80.9% |
| Sudanese | 100.0 /100 | #22 | Exceptional 80.8% |
| Immigrants | Bosnia and Herzegovina | 100.0 /100 | #23 | Exceptional 80.8% |
| Immigrants | Morocco | 100.0 /100 | #24 | Exceptional 80.8% |
| Kenyans | 100.0 /100 | #25 | Exceptional 80.8% |
| Immigrants | Serbia | 100.0 /100 | #26 | Exceptional 80.8% |
| Immigrants | Kenya | 99.9 /100 | #27 | Exceptional 80.7% |
| Immigrants | Uganda | 99.9 /100 | #28 | Exceptional 80.7% |
| Immigrants | South Central Asia | 99.9 /100 | #29 | Exceptional 80.7% |