Czechoslovakian vs Macedonian In Labor Force | Age > 16
COMPARE
Czechoslovakian
Macedonian
In Labor Force | Age > 16
In Labor Force | Age > 16 Comparison
Czechoslovakians
Macedonians
64.3%
IN LABOR FORCE | AGE > 16
1.4/ 100
METRIC RATING
253rd/ 347
METRIC RANK
65.1%
IN LABOR FORCE | AGE > 16
50.0/ 100
METRIC RATING
174th/ 347
METRIC RANK
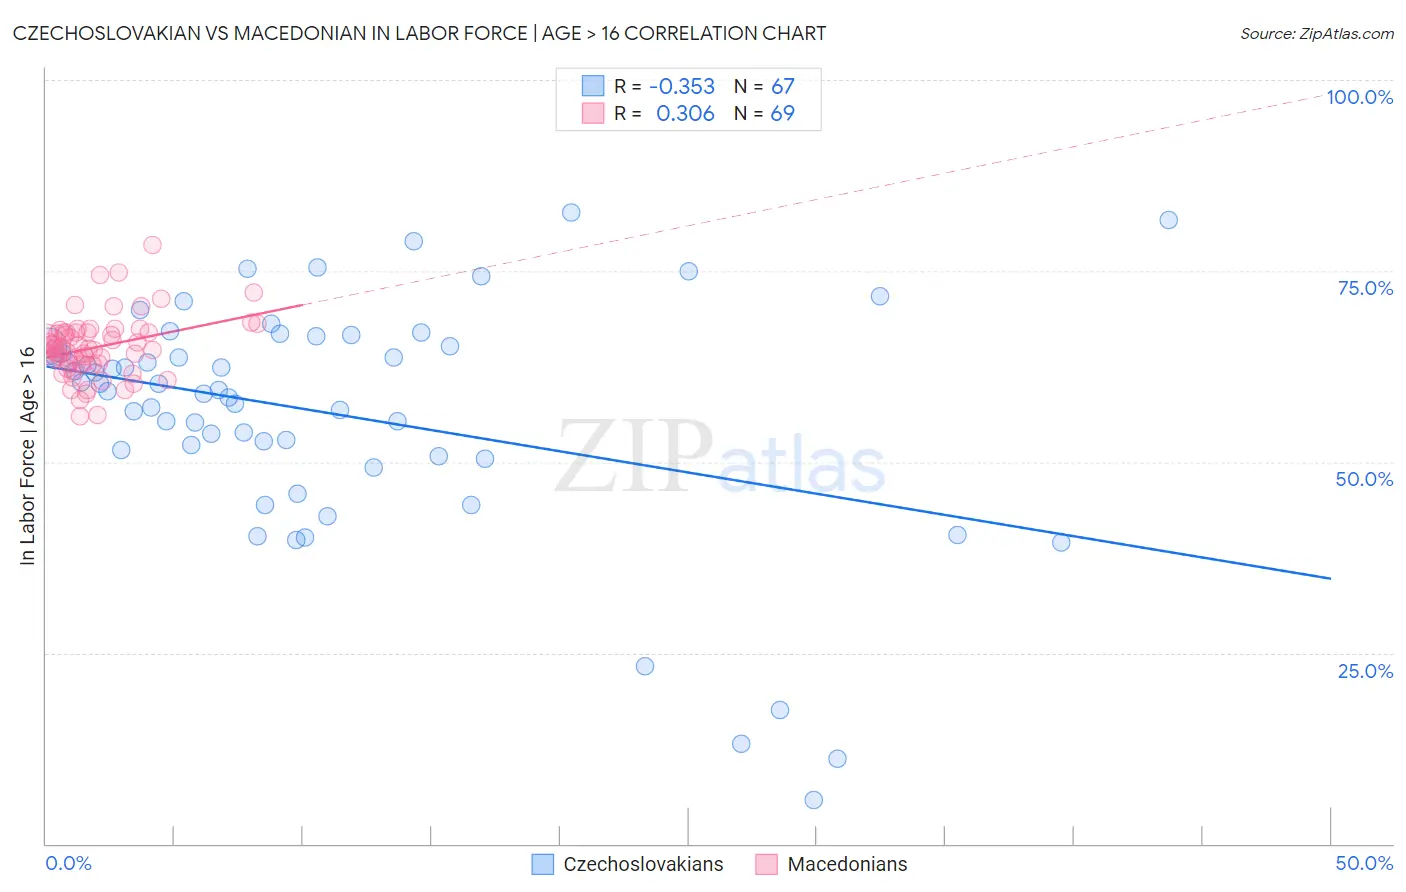
Czechoslovakian vs Macedonian In Labor Force | Age > 16 Correlation Chart
The statistical analysis conducted on geographies consisting of 368,673,303 people shows a mild negative correlation between the proportion of Czechoslovakians and labor force participation rate among population ages 16 and over in the United States with a correlation coefficient (R) of -0.353 and weighted average of 64.3%. Similarly, the statistical analysis conducted on geographies consisting of 132,660,351 people shows a mild positive correlation between the proportion of Macedonians and labor force participation rate among population ages 16 and over in the United States with a correlation coefficient (R) of 0.306 and weighted average of 65.1%, a difference of 1.2%.
In Labor Force | Age > 16 Correlation Summary
| Measurement | Czechoslovakian | Macedonian |
| Minimum | 5.7% | 55.9% |
| Maximum | 82.7% | 78.4% |
| Range | 77.0% | 22.5% |
| Mean | 56.3% | 65.0% |
| Median | 59.4% | 64.8% |
| Interquartile 25% (IQ1) | 50.8% | 62.8% |
| Interquartile 75% (IQ3) | 65.2% | 66.9% |
| Interquartile Range (IQR) | 14.4% | 4.2% |
| Standard Deviation (Sample) | 15.8% | 4.1% |
| Standard Deviation (Population) | 15.7% | 4.0% |
Similar Demographics by In Labor Force | Age > 16
Demographics Similar to Czechoslovakians by In Labor Force | Age > 16
In terms of in labor force | age > 16, the demographic groups most similar to Czechoslovakians are Immigrants from Uzbekistan (64.3%, a difference of 0.0%), Immigrants from Dominican Republic (64.4%, a difference of 0.010%), Portuguese (64.4%, a difference of 0.040%), British West Indian (64.4%, a difference of 0.060%), and German (64.4%, a difference of 0.070%).
| Demographics | Rating | Rank | In Labor Force | Age > 16 |
| Immigrants | Caribbean | 2.3 /100 | #246 | Tragic 64.4% |
| Swiss | 2.1 /100 | #247 | Tragic 64.4% |
| Immigrants | Barbados | 2.1 /100 | #248 | Tragic 64.4% |
| Germans | 1.8 /100 | #249 | Tragic 64.4% |
| British West Indians | 1.8 /100 | #250 | Tragic 64.4% |
| Portuguese | 1.6 /100 | #251 | Tragic 64.4% |
| Immigrants | Dominican Republic | 1.5 /100 | #252 | Tragic 64.4% |
| Czechoslovakians | 1.4 /100 | #253 | Tragic 64.3% |
| Immigrants | Uzbekistan | 1.4 /100 | #254 | Tragic 64.3% |
| Hispanics or Latinos | 1.1 /100 | #255 | Tragic 64.3% |
| Immigrants | Mexico | 1.0 /100 | #256 | Tragic 64.3% |
| Inupiat | 0.8 /100 | #257 | Tragic 64.3% |
| Immigrants | Scotland | 0.8 /100 | #258 | Tragic 64.2% |
| Immigrants | Western Europe | 0.7 /100 | #259 | Tragic 64.2% |
| Marshallese | 0.7 /100 | #260 | Tragic 64.2% |
Demographics Similar to Macedonians by In Labor Force | Age > 16
In terms of in labor force | age > 16, the demographic groups most similar to Macedonians are Nicaraguan (65.1%, a difference of 0.0%), Swedish (65.1%, a difference of 0.030%), Immigrants from Ukraine (65.1%, a difference of 0.040%), Eastern European (65.1%, a difference of 0.040%), and Trinidadian and Tobagonian (65.1%, a difference of 0.050%).
| Demographics | Rating | Rank | In Labor Force | Age > 16 |
| Immigrants | Belarus | 66.0 /100 | #167 | Good 65.2% |
| Serbians | 63.5 /100 | #168 | Good 65.2% |
| Arabs | 62.4 /100 | #169 | Good 65.2% |
| Immigrants | Israel | 61.7 /100 | #170 | Good 65.2% |
| Israelis | 61.6 /100 | #171 | Good 65.2% |
| Immigrants | Sweden | 61.3 /100 | #172 | Good 65.2% |
| Immigrants | Ukraine | 53.7 /100 | #173 | Average 65.1% |
| Macedonians | 50.0 /100 | #174 | Average 65.1% |
| Nicaraguans | 49.7 /100 | #175 | Average 65.1% |
| Swedes | 47.4 /100 | #176 | Average 65.1% |
| Eastern Europeans | 46.2 /100 | #177 | Average 65.1% |
| Trinidadians and Tobagonians | 45.2 /100 | #178 | Average 65.1% |
| Immigrants | Haiti | 43.3 /100 | #179 | Average 65.1% |
| Immigrants | Latvia | 42.9 /100 | #180 | Average 65.1% |
| Immigrants | Panama | 42.4 /100 | #181 | Average 65.1% |