Immigrants from Venezuela vs Immigrants from Czechoslovakia In Labor Force | Age 25-29
COMPARE
Immigrants from Venezuela
Immigrants from Czechoslovakia
In Labor Force | Age 25-29
In Labor Force | Age 25-29 Comparison
Immigrants from Venezuela
Immigrants from Czechoslovakia
84.3%
IN LABOR FORCE | AGE 25-29
12.6/ 100
METRIC RATING
211th/ 347
METRIC RANK
85.4%
IN LABOR FORCE | AGE 25-29
99.3/ 100
METRIC RATING
65th/ 347
METRIC RANK
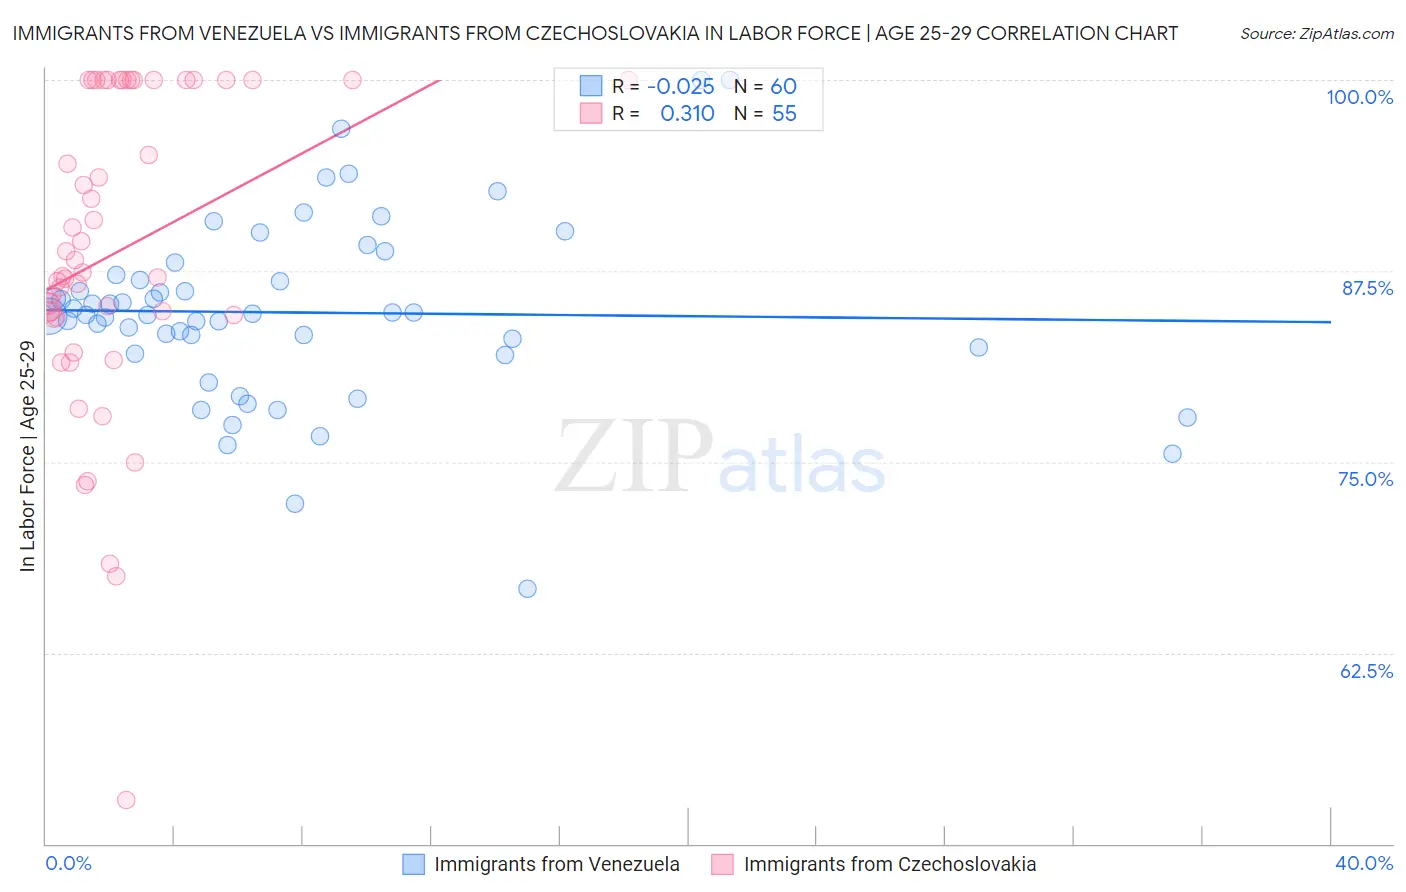
Immigrants from Venezuela vs Immigrants from Czechoslovakia In Labor Force | Age 25-29 Correlation Chart
The statistical analysis conducted on geographies consisting of 287,835,027 people shows no correlation between the proportion of Immigrants from Venezuela and labor force participation rate among population between the ages 25 and 29 in the United States with a correlation coefficient (R) of -0.025 and weighted average of 84.3%. Similarly, the statistical analysis conducted on geographies consisting of 195,420,999 people shows a mild positive correlation between the proportion of Immigrants from Czechoslovakia and labor force participation rate among population between the ages 25 and 29 in the United States with a correlation coefficient (R) of 0.310 and weighted average of 85.4%, a difference of 1.3%.
In Labor Force | Age 25-29 Correlation Summary
| Measurement | Immigrants from Venezuela | Immigrants from Czechoslovakia |
| Minimum | 66.7% | 52.9% |
| Maximum | 100.0% | 100.0% |
| Range | 33.3% | 47.1% |
| Mean | 84.8% | 88.8% |
| Median | 84.7% | 87.4% |
| Interquartile 25% (IQ1) | 82.3% | 84.4% |
| Interquartile 75% (IQ3) | 87.1% | 100.0% |
| Interquartile Range (IQR) | 4.8% | 15.6% |
| Standard Deviation (Sample) | 6.0% | 10.2% |
| Standard Deviation (Population) | 5.9% | 10.1% |
Similar Demographics by In Labor Force | Age 25-29
Demographics Similar to Immigrants from Venezuela by In Labor Force | Age 25-29
In terms of in labor force | age 25-29, the demographic groups most similar to Immigrants from Venezuela are Immigrants from Jordan (84.4%, a difference of 0.0%), Chinese (84.3%, a difference of 0.0%), Immigrants from Armenia (84.4%, a difference of 0.010%), Immigrants from Indonesia (84.4%, a difference of 0.010%), and Subsaharan African (84.3%, a difference of 0.020%).
| Demographics | Rating | Rank | In Labor Force | Age 25-29 |
| Venezuelans | 15.1 /100 | #204 | Poor 84.4% |
| Ecuadorians | 14.8 /100 | #205 | Poor 84.4% |
| Immigrants | Cambodia | 14.3 /100 | #206 | Poor 84.4% |
| Immigrants | Armenia | 13.3 /100 | #207 | Poor 84.4% |
| Immigrants | Indonesia | 13.2 /100 | #208 | Poor 84.4% |
| Immigrants | Jordan | 12.8 /100 | #209 | Poor 84.4% |
| Chinese | 12.7 /100 | #210 | Poor 84.3% |
| Immigrants | Venezuela | 12.6 /100 | #211 | Poor 84.3% |
| Sub-Saharan Africans | 11.7 /100 | #212 | Poor 84.3% |
| Japanese | 11.4 /100 | #213 | Poor 84.3% |
| Lebanese | 11.1 /100 | #214 | Poor 84.3% |
| Immigrants | Syria | 10.7 /100 | #215 | Poor 84.3% |
| Israelis | 9.3 /100 | #216 | Tragic 84.3% |
| Immigrants | Ecuador | 9.3 /100 | #217 | Tragic 84.3% |
| Immigrants | Nigeria | 9.0 /100 | #218 | Tragic 84.3% |
Demographics Similar to Immigrants from Czechoslovakia by In Labor Force | Age 25-29
In terms of in labor force | age 25-29, the demographic groups most similar to Immigrants from Czechoslovakia are Immigrants from Italy (85.4%, a difference of 0.010%), Immigrants from Scotland (85.4%, a difference of 0.010%), Immigrants from Turkey (85.4%, a difference of 0.020%), Immigrants from Cameroon (85.4%, a difference of 0.020%), and Taiwanese (85.4%, a difference of 0.030%).
| Demographics | Rating | Rank | In Labor Force | Age 25-29 |
| Greeks | 99.6 /100 | #58 | Exceptional 85.5% |
| Immigrants | Morocco | 99.5 /100 | #59 | Exceptional 85.5% |
| Thais | 99.5 /100 | #60 | Exceptional 85.5% |
| Serbians | 99.5 /100 | #61 | Exceptional 85.5% |
| Taiwanese | 99.4 /100 | #62 | Exceptional 85.4% |
| Immigrants | Kenya | 99.4 /100 | #63 | Exceptional 85.4% |
| Immigrants | Italy | 99.3 /100 | #64 | Exceptional 85.4% |
| Immigrants | Czechoslovakia | 99.3 /100 | #65 | Exceptional 85.4% |
| Immigrants | Scotland | 99.3 /100 | #66 | Exceptional 85.4% |
| Immigrants | Turkey | 99.2 /100 | #67 | Exceptional 85.4% |
| Immigrants | Cameroon | 99.2 /100 | #68 | Exceptional 85.4% |
| Menominee | 99.1 /100 | #69 | Exceptional 85.4% |
| Immigrants | Sweden | 99.1 /100 | #70 | Exceptional 85.4% |
| Kenyans | 99.0 /100 | #71 | Exceptional 85.4% |
| Immigrants | Australia | 98.9 /100 | #72 | Exceptional 85.3% |