Chickasaw vs Guamanian/Chamorro In Labor Force | Age 20-64
COMPARE
Chickasaw
Guamanian/Chamorro
In Labor Force | Age 20-64
In Labor Force | Age 20-64 Comparison
Chickasaw
Guamanians/Chamorros
76.2%
IN LABOR FORCE | AGE 20-64
0.0/ 100
METRIC RATING
318th/ 347
METRIC RANK
79.1%
IN LABOR FORCE | AGE 20-64
4.5/ 100
METRIC RATING
232nd/ 347
METRIC RANK
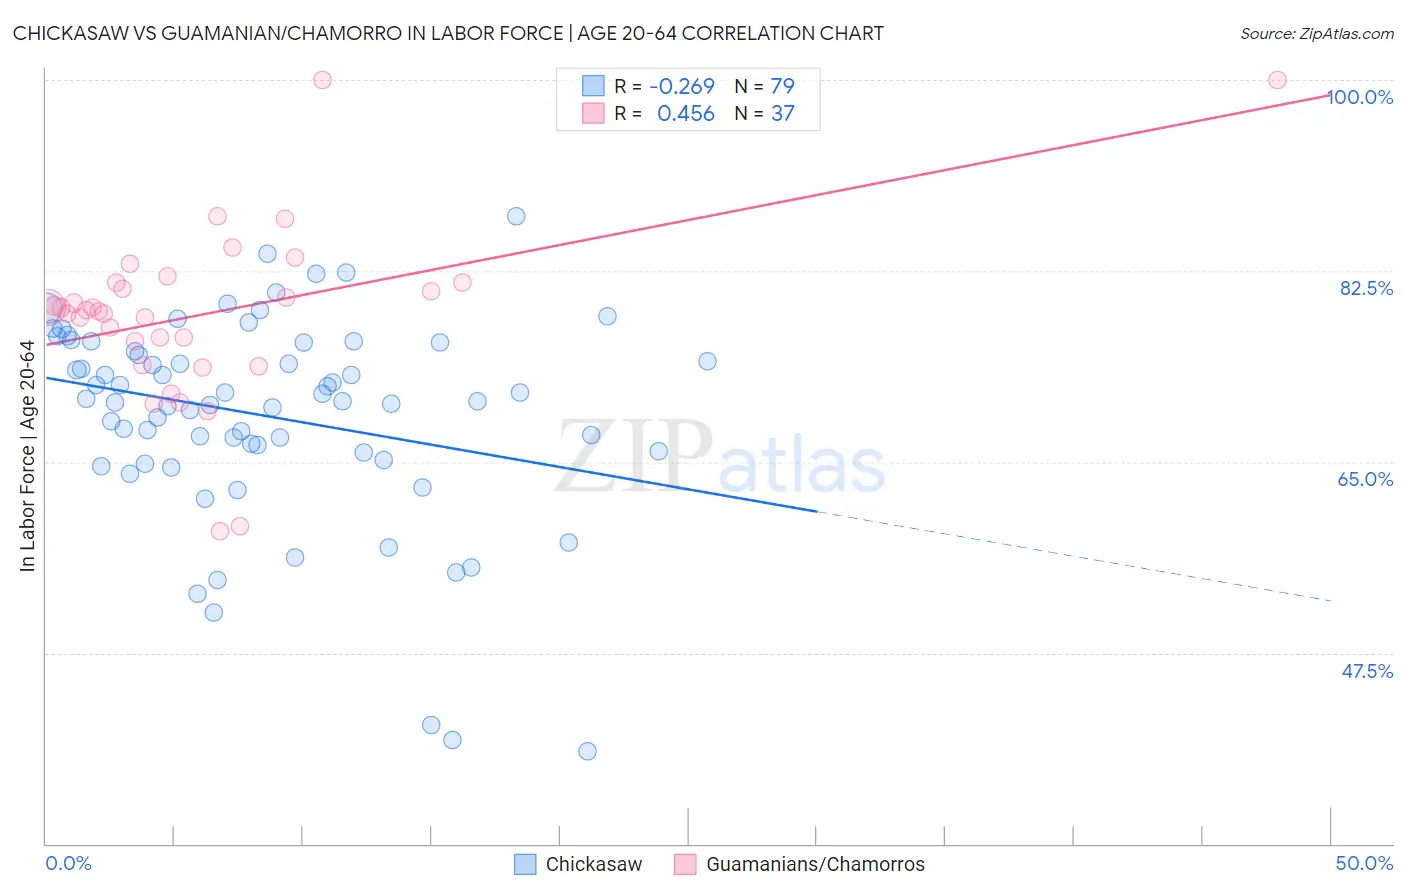
Chickasaw vs Guamanian/Chamorro In Labor Force | Age 20-64 Correlation Chart
The statistical analysis conducted on geographies consisting of 147,722,293 people shows a weak negative correlation between the proportion of Chickasaw and labor force participation rate among population between the ages 20 and 64 in the United States with a correlation coefficient (R) of -0.269 and weighted average of 76.2%. Similarly, the statistical analysis conducted on geographies consisting of 221,956,228 people shows a moderate positive correlation between the proportion of Guamanians/Chamorros and labor force participation rate among population between the ages 20 and 64 in the United States with a correlation coefficient (R) of 0.456 and weighted average of 79.1%, a difference of 3.8%.
In Labor Force | Age 20-64 Correlation Summary
| Measurement | Chickasaw | Guamanian/Chamorro |
| Minimum | 38.5% | 58.6% |
| Maximum | 87.5% | 100.0% |
| Range | 49.0% | 41.4% |
| Mean | 69.2% | 78.6% |
| Median | 70.5% | 79.0% |
| Interquartile 25% (IQ1) | 65.8% | 74.9% |
| Interquartile 75% (IQ3) | 75.9% | 81.4% |
| Interquartile Range (IQR) | 10.1% | 6.5% |
| Standard Deviation (Sample) | 9.4% | 8.1% |
| Standard Deviation (Population) | 9.4% | 7.9% |
Similar Demographics by In Labor Force | Age 20-64
Demographics Similar to Chickasaw by In Labor Force | Age 20-64
In terms of in labor force | age 20-64, the demographic groups most similar to Chickasaw are Cherokee (76.2%, a difference of 0.040%), Inupiat (76.1%, a difference of 0.16%), Yaqui (76.5%, a difference of 0.44%), Yakama (75.8%, a difference of 0.55%), and Ottawa (76.7%, a difference of 0.63%).
| Demographics | Rating | Rank | In Labor Force | Age 20-64 |
| Blackfeet | 0.0 /100 | #311 | Tragic 77.0% |
| Alaskan Athabascans | 0.0 /100 | #312 | Tragic 76.9% |
| Shoshone | 0.0 /100 | #313 | Tragic 76.8% |
| Blacks/African Americans | 0.0 /100 | #314 | Tragic 76.8% |
| Ottawa | 0.0 /100 | #315 | Tragic 76.7% |
| Yaqui | 0.0 /100 | #316 | Tragic 76.5% |
| Cherokee | 0.0 /100 | #317 | Tragic 76.2% |
| Chickasaw | 0.0 /100 | #318 | Tragic 76.2% |
| Inupiat | 0.0 /100 | #319 | Tragic 76.1% |
| Yakama | 0.0 /100 | #320 | Tragic 75.8% |
| Seminole | 0.0 /100 | #321 | Tragic 75.5% |
| Dutch West Indians | 0.0 /100 | #322 | Tragic 75.5% |
| Cajuns | 0.0 /100 | #323 | Tragic 75.5% |
| Choctaw | 0.0 /100 | #324 | Tragic 75.4% |
| Menominee | 0.0 /100 | #325 | Tragic 75.3% |
Demographics Similar to Guamanians/Chamorros by In Labor Force | Age 20-64
In terms of in labor force | age 20-64, the demographic groups most similar to Guamanians/Chamorros are Lebanese (79.1%, a difference of 0.020%), Japanese (79.1%, a difference of 0.030%), Panamanian (79.1%, a difference of 0.050%), Alsatian (79.1%, a difference of 0.050%), and Native Hawaiian (79.1%, a difference of 0.050%).
| Demographics | Rating | Rank | In Labor Force | Age 20-64 |
| Portuguese | 6.4 /100 | #225 | Tragic 79.1% |
| Central Americans | 5.9 /100 | #226 | Tragic 79.1% |
| Immigrants | Western Europe | 5.9 /100 | #227 | Tragic 79.1% |
| Panamanians | 5.7 /100 | #228 | Tragic 79.1% |
| Alsatians | 5.7 /100 | #229 | Tragic 79.1% |
| Native Hawaiians | 5.6 /100 | #230 | Tragic 79.1% |
| Lebanese | 5.1 /100 | #231 | Tragic 79.1% |
| Guamanians/Chamorros | 4.5 /100 | #232 | Tragic 79.1% |
| Japanese | 4.0 /100 | #233 | Tragic 79.1% |
| Immigrants | Canada | 3.2 /100 | #234 | Tragic 79.0% |
| Tlingit-Haida | 3.2 /100 | #235 | Tragic 79.0% |
| Samoans | 2.9 /100 | #236 | Tragic 79.0% |
| Immigrants | North America | 2.9 /100 | #237 | Tragic 79.0% |
| Immigrants | Jamaica | 2.6 /100 | #238 | Tragic 79.0% |
| Welsh | 2.4 /100 | #239 | Tragic 79.0% |