Russian vs Guamanian/Chamorro In Labor Force | Age 20-64
COMPARE
Russian
Guamanian/Chamorro
In Labor Force | Age 20-64
In Labor Force | Age 20-64 Comparison
Russians
Guamanians/Chamorros
80.0%
IN LABOR FORCE | AGE 20-64
95.5/ 100
METRIC RATING
103rd/ 347
METRIC RANK
79.1%
IN LABOR FORCE | AGE 20-64
4.5/ 100
METRIC RATING
232nd/ 347
METRIC RANK
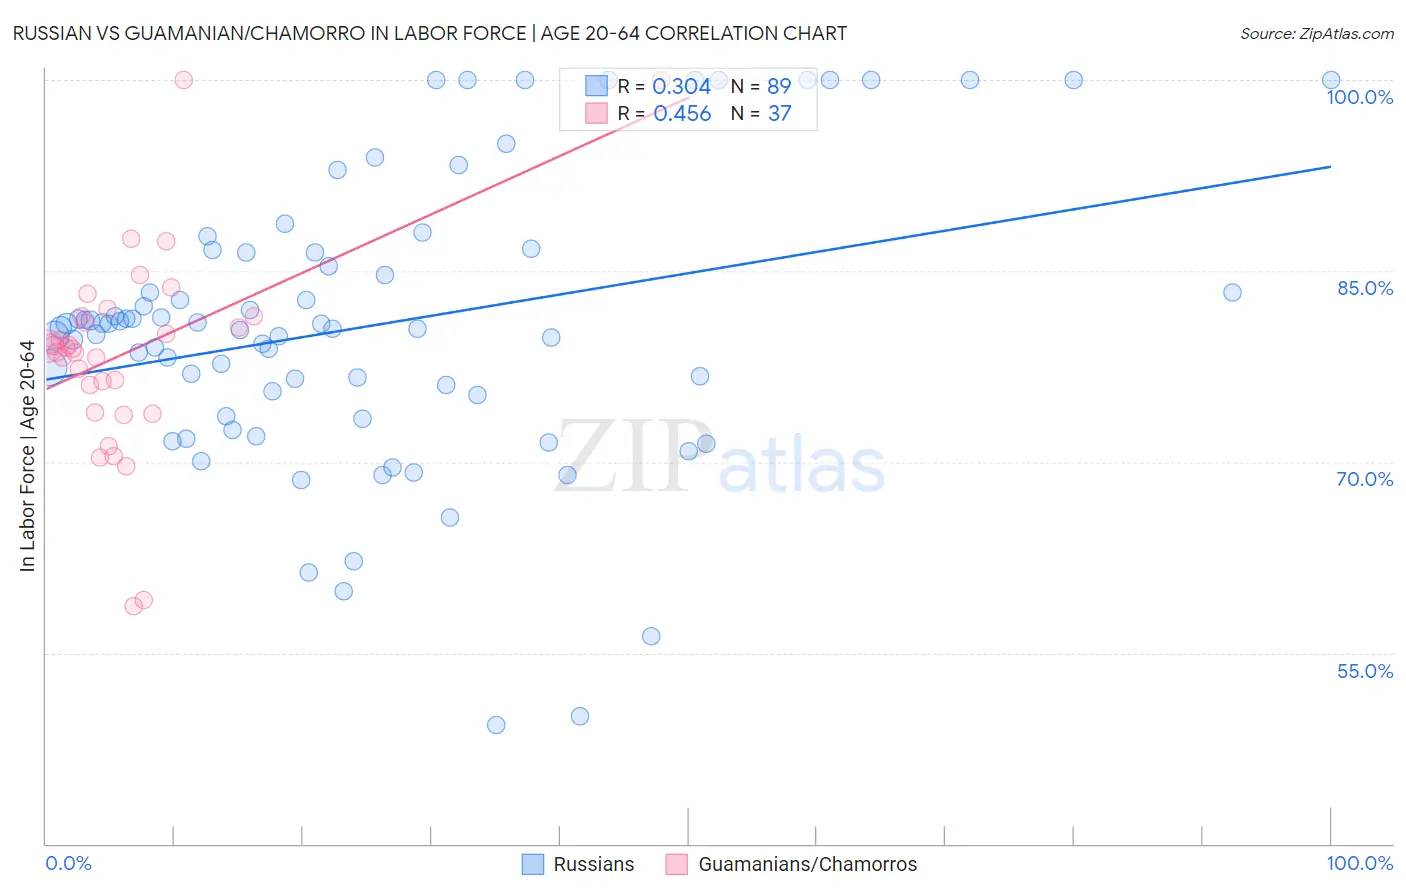
Russian vs Guamanian/Chamorro In Labor Force | Age 20-64 Correlation Chart
The statistical analysis conducted on geographies consisting of 512,263,785 people shows a mild positive correlation between the proportion of Russians and labor force participation rate among population between the ages 20 and 64 in the United States with a correlation coefficient (R) of 0.304 and weighted average of 80.0%. Similarly, the statistical analysis conducted on geographies consisting of 221,956,228 people shows a moderate positive correlation between the proportion of Guamanians/Chamorros and labor force participation rate among population between the ages 20 and 64 in the United States with a correlation coefficient (R) of 0.456 and weighted average of 79.1%, a difference of 1.2%.
In Labor Force | Age 20-64 Correlation Summary
| Measurement | Russian | Guamanian/Chamorro |
| Minimum | 49.3% | 58.6% |
| Maximum | 100.0% | 100.0% |
| Range | 50.7% | 41.4% |
| Mean | 80.7% | 78.6% |
| Median | 80.5% | 79.0% |
| Interquartile 25% (IQ1) | 74.4% | 74.9% |
| Interquartile 75% (IQ3) | 86.5% | 81.4% |
| Interquartile Range (IQR) | 12.0% | 6.5% |
| Standard Deviation (Sample) | 11.2% | 8.1% |
| Standard Deviation (Population) | 11.2% | 7.9% |
Similar Demographics by In Labor Force | Age 20-64
Demographics Similar to Russians by In Labor Force | Age 20-64
In terms of in labor force | age 20-64, the demographic groups most similar to Russians are Palestinian (80.0%, a difference of 0.0%), Immigrants from Australia (80.0%, a difference of 0.0%), Immigrants from Chile (80.1%, a difference of 0.010%), Filipino (80.1%, a difference of 0.010%), and Venezuelan (80.0%, a difference of 0.010%).
| Demographics | Rating | Rank | In Labor Force | Age 20-64 |
| Immigrants | Malaysia | 95.9 /100 | #96 | Exceptional 80.1% |
| South Americans | 95.9 /100 | #97 | Exceptional 80.1% |
| Immigrants | Uruguay | 95.8 /100 | #98 | Exceptional 80.1% |
| Immigrants | Chile | 95.7 /100 | #99 | Exceptional 80.1% |
| Filipinos | 95.6 /100 | #100 | Exceptional 80.1% |
| Palestinians | 95.5 /100 | #101 | Exceptional 80.0% |
| Immigrants | Australia | 95.5 /100 | #102 | Exceptional 80.0% |
| Russians | 95.5 /100 | #103 | Exceptional 80.0% |
| Venezuelans | 95.3 /100 | #104 | Exceptional 80.0% |
| Immigrants | Ghana | 95.0 /100 | #105 | Exceptional 80.0% |
| Greeks | 94.8 /100 | #106 | Exceptional 80.0% |
| Immigrants | Jordan | 94.8 /100 | #107 | Exceptional 80.0% |
| Iranians | 94.3 /100 | #108 | Exceptional 80.0% |
| Immigrants | Argentina | 94.1 /100 | #109 | Exceptional 80.0% |
| Estonians | 94.0 /100 | #110 | Exceptional 80.0% |
Demographics Similar to Guamanians/Chamorros by In Labor Force | Age 20-64
In terms of in labor force | age 20-64, the demographic groups most similar to Guamanians/Chamorros are Lebanese (79.1%, a difference of 0.020%), Japanese (79.1%, a difference of 0.030%), Panamanian (79.1%, a difference of 0.050%), Alsatian (79.1%, a difference of 0.050%), and Native Hawaiian (79.1%, a difference of 0.050%).
| Demographics | Rating | Rank | In Labor Force | Age 20-64 |
| Portuguese | 6.4 /100 | #225 | Tragic 79.1% |
| Central Americans | 5.9 /100 | #226 | Tragic 79.1% |
| Immigrants | Western Europe | 5.9 /100 | #227 | Tragic 79.1% |
| Panamanians | 5.7 /100 | #228 | Tragic 79.1% |
| Alsatians | 5.7 /100 | #229 | Tragic 79.1% |
| Native Hawaiians | 5.6 /100 | #230 | Tragic 79.1% |
| Lebanese | 5.1 /100 | #231 | Tragic 79.1% |
| Guamanians/Chamorros | 4.5 /100 | #232 | Tragic 79.1% |
| Japanese | 4.0 /100 | #233 | Tragic 79.1% |
| Immigrants | Canada | 3.2 /100 | #234 | Tragic 79.0% |
| Tlingit-Haida | 3.2 /100 | #235 | Tragic 79.0% |
| Samoans | 2.9 /100 | #236 | Tragic 79.0% |
| Immigrants | North America | 2.9 /100 | #237 | Tragic 79.0% |
| Immigrants | Jamaica | 2.6 /100 | #238 | Tragic 79.0% |
| Welsh | 2.4 /100 | #239 | Tragic 79.0% |