Chickasaw vs Immigrants from Asia In Labor Force | Age 20-64
COMPARE
Chickasaw
Immigrants from Asia
In Labor Force | Age 20-64
In Labor Force | Age 20-64 Comparison
Chickasaw
Immigrants from Asia
76.2%
IN LABOR FORCE | AGE 20-64
0.0/ 100
METRIC RATING
318th/ 347
METRIC RANK
80.1%
IN LABOR FORCE | AGE 20-64
96.0/ 100
METRIC RATING
94th/ 347
METRIC RANK
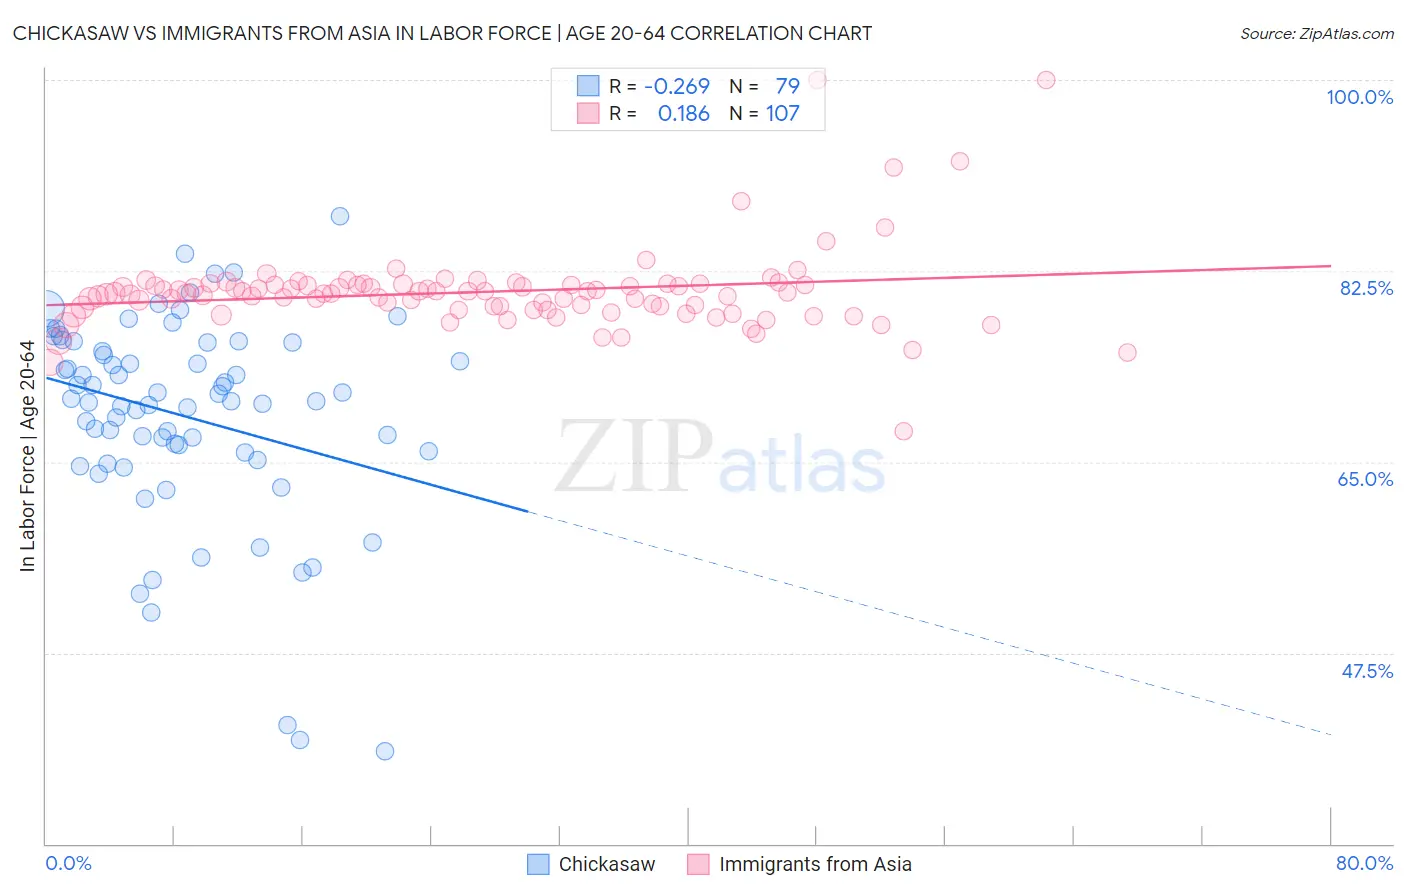
Chickasaw vs Immigrants from Asia In Labor Force | Age 20-64 Correlation Chart
The statistical analysis conducted on geographies consisting of 147,722,293 people shows a weak negative correlation between the proportion of Chickasaw and labor force participation rate among population between the ages 20 and 64 in the United States with a correlation coefficient (R) of -0.269 and weighted average of 76.2%. Similarly, the statistical analysis conducted on geographies consisting of 549,180,709 people shows a poor positive correlation between the proportion of Immigrants from Asia and labor force participation rate among population between the ages 20 and 64 in the United States with a correlation coefficient (R) of 0.186 and weighted average of 80.1%, a difference of 5.1%.
In Labor Force | Age 20-64 Correlation Summary
| Measurement | Chickasaw | Immigrants from Asia |
| Minimum | 38.5% | 67.8% |
| Maximum | 87.5% | 100.0% |
| Range | 49.0% | 32.2% |
| Mean | 69.2% | 80.6% |
| Median | 70.5% | 80.5% |
| Interquartile 25% (IQ1) | 65.8% | 78.9% |
| Interquartile 75% (IQ3) | 75.9% | 81.2% |
| Interquartile Range (IQR) | 10.1% | 2.3% |
| Standard Deviation (Sample) | 9.4% | 3.9% |
| Standard Deviation (Population) | 9.4% | 3.9% |
Similar Demographics by In Labor Force | Age 20-64
Demographics Similar to Chickasaw by In Labor Force | Age 20-64
In terms of in labor force | age 20-64, the demographic groups most similar to Chickasaw are Cherokee (76.2%, a difference of 0.040%), Inupiat (76.1%, a difference of 0.16%), Yaqui (76.5%, a difference of 0.44%), Yakama (75.8%, a difference of 0.55%), and Ottawa (76.7%, a difference of 0.63%).
| Demographics | Rating | Rank | In Labor Force | Age 20-64 |
| Blackfeet | 0.0 /100 | #311 | Tragic 77.0% |
| Alaskan Athabascans | 0.0 /100 | #312 | Tragic 76.9% |
| Shoshone | 0.0 /100 | #313 | Tragic 76.8% |
| Blacks/African Americans | 0.0 /100 | #314 | Tragic 76.8% |
| Ottawa | 0.0 /100 | #315 | Tragic 76.7% |
| Yaqui | 0.0 /100 | #316 | Tragic 76.5% |
| Cherokee | 0.0 /100 | #317 | Tragic 76.2% |
| Chickasaw | 0.0 /100 | #318 | Tragic 76.2% |
| Inupiat | 0.0 /100 | #319 | Tragic 76.1% |
| Yakama | 0.0 /100 | #320 | Tragic 75.8% |
| Seminole | 0.0 /100 | #321 | Tragic 75.5% |
| Dutch West Indians | 0.0 /100 | #322 | Tragic 75.5% |
| Cajuns | 0.0 /100 | #323 | Tragic 75.5% |
| Choctaw | 0.0 /100 | #324 | Tragic 75.4% |
| Menominee | 0.0 /100 | #325 | Tragic 75.3% |
Demographics Similar to Immigrants from Asia by In Labor Force | Age 20-64
In terms of in labor force | age 20-64, the demographic groups most similar to Immigrants from Asia are Yugoslavian (80.1%, a difference of 0.010%), Immigrants from Malaysia (80.1%, a difference of 0.010%), South American (80.1%, a difference of 0.010%), Immigrants from Uruguay (80.1%, a difference of 0.010%), and Immigrants from Belarus (80.1%, a difference of 0.020%).
| Demographics | Rating | Rank | In Labor Force | Age 20-64 |
| Croatians | 97.1 /100 | #87 | Exceptional 80.1% |
| Chileans | 97.0 /100 | #88 | Exceptional 80.1% |
| Immigrants | Venezuela | 96.8 /100 | #89 | Exceptional 80.1% |
| Poles | 96.8 /100 | #90 | Exceptional 80.1% |
| Uruguayans | 96.7 /100 | #91 | Exceptional 80.1% |
| Ghanaians | 96.7 /100 | #92 | Exceptional 80.1% |
| Immigrants | Belarus | 96.4 /100 | #93 | Exceptional 80.1% |
| Immigrants | Asia | 96.0 /100 | #94 | Exceptional 80.1% |
| Yugoslavians | 95.9 /100 | #95 | Exceptional 80.1% |
| Immigrants | Malaysia | 95.9 /100 | #96 | Exceptional 80.1% |
| South Americans | 95.9 /100 | #97 | Exceptional 80.1% |
| Immigrants | Uruguay | 95.8 /100 | #98 | Exceptional 80.1% |
| Immigrants | Chile | 95.7 /100 | #99 | Exceptional 80.1% |
| Filipinos | 95.6 /100 | #100 | Exceptional 80.1% |
| Palestinians | 95.5 /100 | #101 | Exceptional 80.0% |