Chickasaw vs Guamanian/Chamorro Disability Age Over 75
COMPARE
Chickasaw
Guamanian/Chamorro
Disability Age Over 75
Disability Age Over 75 Comparison
Chickasaw
Guamanians/Chamorros
51.2%
DISABILITY AGE OVER 75
0.0/ 100
METRIC RATING
316th/ 347
METRIC RANK
49.4%
DISABILITY AGE OVER 75
0.0/ 100
METRIC RATING
279th/ 347
METRIC RANK
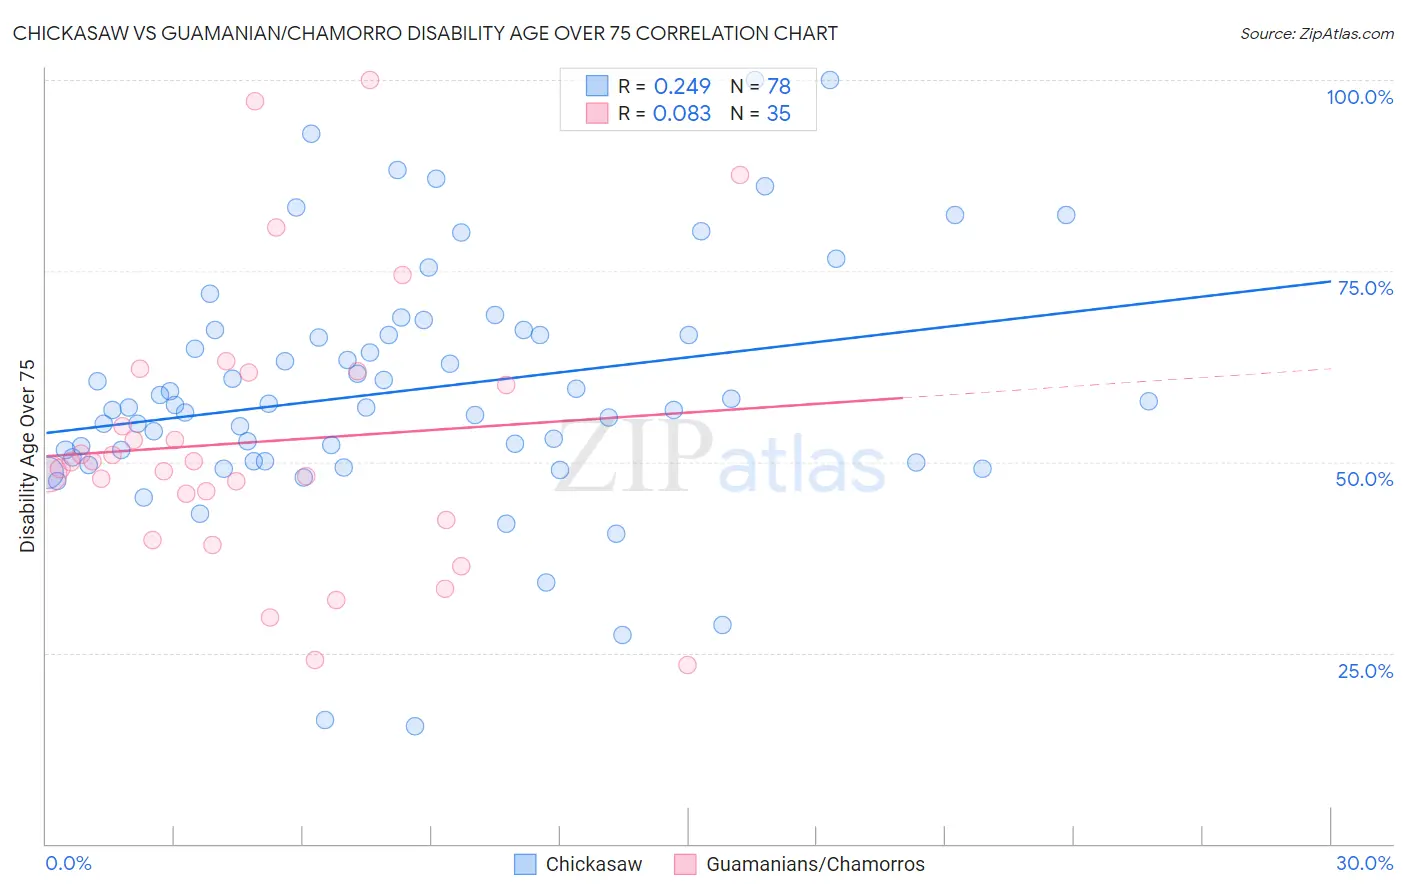
Chickasaw vs Guamanian/Chamorro Disability Age Over 75 Correlation Chart
The statistical analysis conducted on geographies consisting of 147,558,416 people shows a weak positive correlation between the proportion of Chickasaw and percentage of population with a disability over the age of 75 in the United States with a correlation coefficient (R) of 0.249 and weighted average of 51.2%. Similarly, the statistical analysis conducted on geographies consisting of 221,408,393 people shows a slight positive correlation between the proportion of Guamanians/Chamorros and percentage of population with a disability over the age of 75 in the United States with a correlation coefficient (R) of 0.083 and weighted average of 49.4%, a difference of 3.6%.
Disability Age Over 75 Correlation Summary
| Measurement | Chickasaw | Guamanian/Chamorro |
| Minimum | 15.4% | 23.3% |
| Maximum | 100.0% | 100.0% |
| Range | 84.6% | 76.7% |
| Mean | 59.3% | 52.7% |
| Median | 57.3% | 50.0% |
| Interquartile 25% (IQ1) | 50.1% | 42.4% |
| Interquartile 75% (IQ3) | 66.7% | 61.7% |
| Interquartile Range (IQR) | 16.6% | 19.3% |
| Standard Deviation (Sample) | 16.1% | 18.1% |
| Standard Deviation (Population) | 16.0% | 17.8% |
Similar Demographics by Disability Age Over 75
Demographics Similar to Chickasaw by Disability Age Over 75
In terms of disability age over 75, the demographic groups most similar to Chickasaw are Mexican (51.1%, a difference of 0.14%), Yakama (51.3%, a difference of 0.18%), Immigrants from Mexico (51.1%, a difference of 0.19%), Seminole (51.5%, a difference of 0.51%), and Creek (51.5%, a difference of 0.51%).
| Demographics | Rating | Rank | Disability Age Over 75 |
| Aleuts | 0.0 /100 | #309 | Tragic 50.6% |
| Tlingit-Haida | 0.0 /100 | #310 | Tragic 50.6% |
| Cajuns | 0.0 /100 | #311 | Tragic 50.7% |
| Cheyenne | 0.0 /100 | #312 | Tragic 50.9% |
| Immigrants | Azores | 0.0 /100 | #313 | Tragic 50.9% |
| Immigrants | Mexico | 0.0 /100 | #314 | Tragic 51.1% |
| Mexicans | 0.0 /100 | #315 | Tragic 51.1% |
| Chickasaw | 0.0 /100 | #316 | Tragic 51.2% |
| Yakama | 0.0 /100 | #317 | Tragic 51.3% |
| Seminole | 0.0 /100 | #318 | Tragic 51.5% |
| Creek | 0.0 /100 | #319 | Tragic 51.5% |
| Paiute | 0.0 /100 | #320 | Tragic 51.5% |
| Dutch West Indians | 0.0 /100 | #321 | Tragic 51.5% |
| Comanche | 0.0 /100 | #322 | Tragic 51.7% |
| Immigrants | Yemen | 0.0 /100 | #323 | Tragic 52.0% |
Demographics Similar to Guamanians/Chamorros by Disability Age Over 75
In terms of disability age over 75, the demographic groups most similar to Guamanians/Chamorros are Bangladeshi (49.4%, a difference of 0.060%), Belizean (49.4%, a difference of 0.070%), Black/African American (49.5%, a difference of 0.21%), Samoan (49.5%, a difference of 0.24%), and Immigrants from Latin America (49.5%, a difference of 0.29%).
| Demographics | Rating | Rank | Disability Age Over 75 |
| Assyrians/Chaldeans/Syriacs | 0.2 /100 | #272 | Tragic 49.1% |
| Immigrants | Iraq | 0.1 /100 | #273 | Tragic 49.1% |
| Immigrants | Guatemala | 0.1 /100 | #274 | Tragic 49.1% |
| Immigrants | Dominica | 0.1 /100 | #275 | Tragic 49.1% |
| Immigrants | Uzbekistan | 0.1 /100 | #276 | Tragic 49.2% |
| Hawaiians | 0.1 /100 | #277 | Tragic 49.2% |
| Immigrants | Laos | 0.1 /100 | #278 | Tragic 49.2% |
| Guamanians/Chamorros | 0.0 /100 | #279 | Tragic 49.4% |
| Bangladeshis | 0.0 /100 | #280 | Tragic 49.4% |
| Belizeans | 0.0 /100 | #281 | Tragic 49.4% |
| Blacks/African Americans | 0.0 /100 | #282 | Tragic 49.5% |
| Samoans | 0.0 /100 | #283 | Tragic 49.5% |
| Immigrants | Latin America | 0.0 /100 | #284 | Tragic 49.5% |
| Crow | 0.0 /100 | #285 | Tragic 49.6% |
| Immigrants | Belize | 0.0 /100 | #286 | Tragic 49.6% |