Chickasaw vs Czech In Labor Force | Age 20-64
COMPARE
Chickasaw
Czech
In Labor Force | Age 20-64
In Labor Force | Age 20-64 Comparison
Chickasaw
Czechs
76.2%
IN LABOR FORCE | AGE 20-64
0.0/ 100
METRIC RATING
318th/ 347
METRIC RANK
80.5%
IN LABOR FORCE | AGE 20-64
99.7/ 100
METRIC RATING
43rd/ 347
METRIC RANK
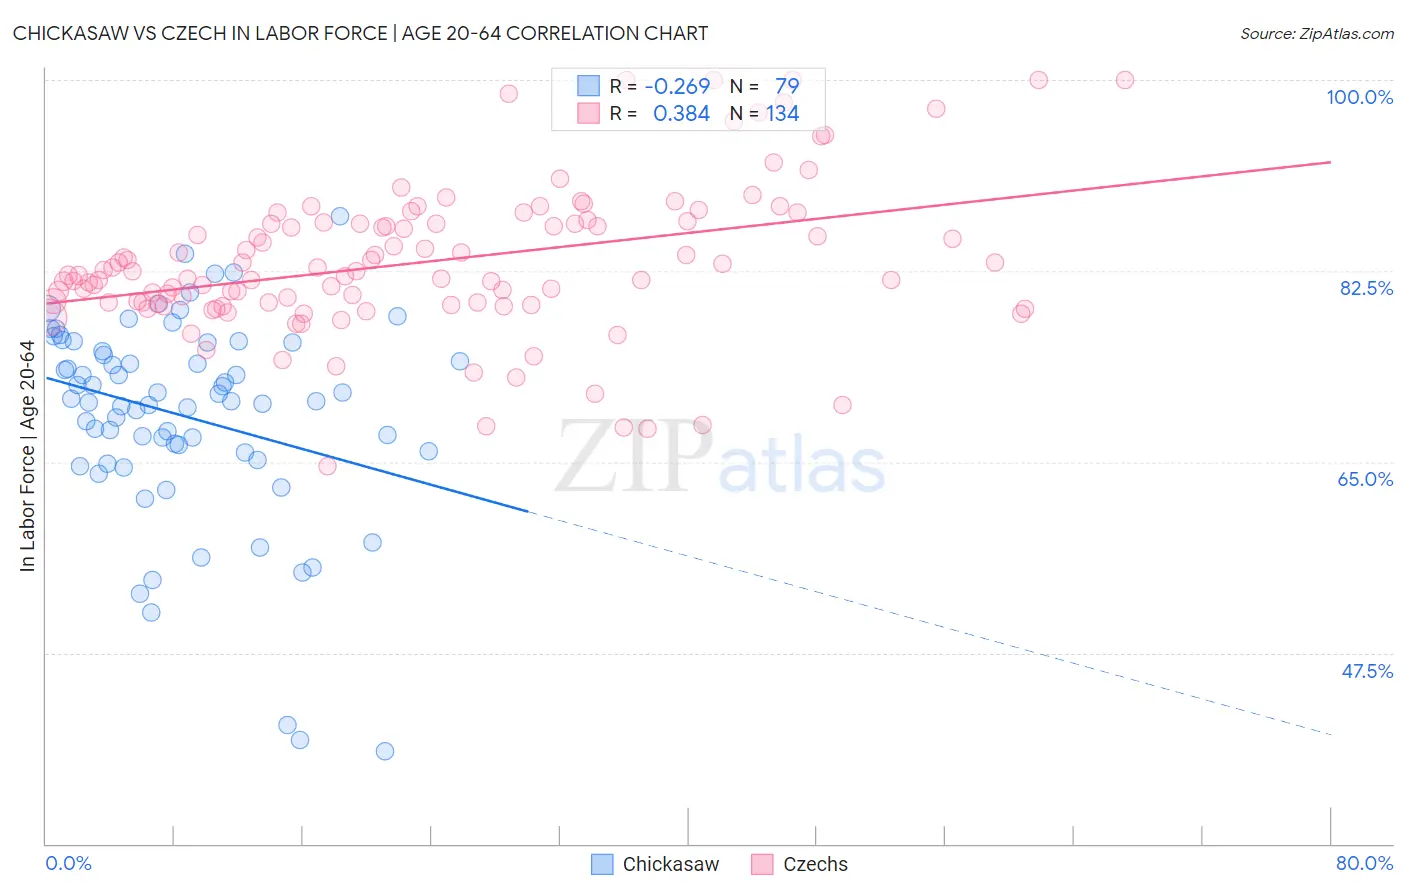
Chickasaw vs Czech In Labor Force | Age 20-64 Correlation Chart
The statistical analysis conducted on geographies consisting of 147,722,293 people shows a weak negative correlation between the proportion of Chickasaw and labor force participation rate among population between the ages 20 and 64 in the United States with a correlation coefficient (R) of -0.269 and weighted average of 76.2%. Similarly, the statistical analysis conducted on geographies consisting of 484,822,871 people shows a mild positive correlation between the proportion of Czechs and labor force participation rate among population between the ages 20 and 64 in the United States with a correlation coefficient (R) of 0.384 and weighted average of 80.5%, a difference of 5.7%.
In Labor Force | Age 20-64 Correlation Summary
| Measurement | Chickasaw | Czech |
| Minimum | 38.5% | 64.6% |
| Maximum | 87.5% | 100.0% |
| Range | 49.0% | 35.4% |
| Mean | 69.2% | 83.3% |
| Median | 70.5% | 82.3% |
| Interquartile 25% (IQ1) | 65.8% | 79.6% |
| Interquartile 75% (IQ3) | 75.9% | 86.8% |
| Interquartile Range (IQR) | 10.1% | 7.3% |
| Standard Deviation (Sample) | 9.4% | 6.9% |
| Standard Deviation (Population) | 9.4% | 6.8% |
Similar Demographics by In Labor Force | Age 20-64
Demographics Similar to Chickasaw by In Labor Force | Age 20-64
In terms of in labor force | age 20-64, the demographic groups most similar to Chickasaw are Cherokee (76.2%, a difference of 0.040%), Inupiat (76.1%, a difference of 0.16%), Yaqui (76.5%, a difference of 0.44%), Yakama (75.8%, a difference of 0.55%), and Ottawa (76.7%, a difference of 0.63%).
| Demographics | Rating | Rank | In Labor Force | Age 20-64 |
| Blackfeet | 0.0 /100 | #311 | Tragic 77.0% |
| Alaskan Athabascans | 0.0 /100 | #312 | Tragic 76.9% |
| Shoshone | 0.0 /100 | #313 | Tragic 76.8% |
| Blacks/African Americans | 0.0 /100 | #314 | Tragic 76.8% |
| Ottawa | 0.0 /100 | #315 | Tragic 76.7% |
| Yaqui | 0.0 /100 | #316 | Tragic 76.5% |
| Cherokee | 0.0 /100 | #317 | Tragic 76.2% |
| Chickasaw | 0.0 /100 | #318 | Tragic 76.2% |
| Inupiat | 0.0 /100 | #319 | Tragic 76.1% |
| Yakama | 0.0 /100 | #320 | Tragic 75.8% |
| Seminole | 0.0 /100 | #321 | Tragic 75.5% |
| Dutch West Indians | 0.0 /100 | #322 | Tragic 75.5% |
| Cajuns | 0.0 /100 | #323 | Tragic 75.5% |
| Choctaw | 0.0 /100 | #324 | Tragic 75.4% |
| Menominee | 0.0 /100 | #325 | Tragic 75.3% |
Demographics Similar to Czechs by In Labor Force | Age 20-64
In terms of in labor force | age 20-64, the demographic groups most similar to Czechs are Latvian (80.5%, a difference of 0.010%), Immigrants from Liberia (80.5%, a difference of 0.030%), Immigrants from Middle Africa (80.5%, a difference of 0.030%), Brazilian (80.5%, a difference of 0.040%), and Immigrants from Zimbabwe (80.5%, a difference of 0.040%).
| Demographics | Rating | Rank | In Labor Force | Age 20-64 |
| Paraguayans | 99.8 /100 | #36 | Exceptional 80.6% |
| Immigrants | Moldova | 99.8 /100 | #37 | Exceptional 80.6% |
| Ugandans | 99.8 /100 | #38 | Exceptional 80.6% |
| Brazilians | 99.8 /100 | #39 | Exceptional 80.5% |
| Immigrants | Zimbabwe | 99.8 /100 | #40 | Exceptional 80.5% |
| Immigrants | Liberia | 99.8 /100 | #41 | Exceptional 80.5% |
| Latvians | 99.8 /100 | #42 | Exceptional 80.5% |
| Czechs | 99.7 /100 | #43 | Exceptional 80.5% |
| Immigrants | Middle Africa | 99.7 /100 | #44 | Exceptional 80.5% |
| Slovenes | 99.7 /100 | #45 | Exceptional 80.5% |
| Immigrants | Pakistan | 99.6 /100 | #46 | Exceptional 80.5% |
| Immigrants | Africa | 99.6 /100 | #47 | Exceptional 80.4% |
| Immigrants | Hong Kong | 99.5 /100 | #48 | Exceptional 80.4% |
| Immigrants | Greece | 99.4 /100 | #49 | Exceptional 80.4% |
| Immigrants | Sudan | 99.4 /100 | #50 | Exceptional 80.4% |